Hypothesis Testing Flashcards
(8 cards)
There are 3 approaches to tackle inferentail hypothesis testing. What are they?
T-test for the slope
F-test for the slope
Confidence interval test for the slope
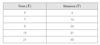
Using the sample data set pictured, how would you use the confidence interval approach to determine if the relationship between x and y is significant using the following hypothesis:
H0: β1=0 (there is no relationship between X and Y)
H1: β1≠0 (there is relationship between X and Y)
(Hint: up to step 3 of 5)
Based on our finding of the confidence interval, would we reject or not reject the null hypothesis?

Step 1: State the hypothesis
H0: β1=0 (there is no relationship between X and Y)
H1: β1≠0 (there is relationship between X and Y)
Step 2: State the alpha. (Most commonly used is 0.05)
α=0.05
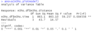
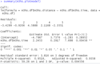
Step 3: Determine the coefficients and t critical values for the model
Step 4: Calculate the confidence interval for the relationship using the following formula:
B̂1−ta/2∗SB̂1 ≤ β1 ≤ B̂1+ta/2∗SB̂1
- 245 - 3.1824 x 0.292 ≤ 0 ≤ 2.245 + 3.1824 x 0.292
- 3157 ≤ 0 ≤ 3.1736
Step 5: Decision
Reject H0 because the hypothesized β1 = 0 does not fall within the confidence interval of the slope.
Using the sample data set pictured, how would you calculate the F critical values for the regression model with the following hypothesis:
H0: β1=0 (there is no relationship between X and Y)
H1: β1≠0 (there is relationship between X and Y)
(Hint: up to step 4 of 5)
Based on our finding of the critical value, would we reject or not reject the null hypothesis?
Step 1: State the hypothesis
H0: β1=0 (there is no relationship between X and Y)
H1: β1≠0 (there is relationship between X and Y)
Step 2: State the alpha. (Most commonly used is 0.05)
α=0.05
Step 3: Calculate the test statistic using the formula, reference the ANOVA summary.
MSR/MSE
- 104/14.565
- 257
Step 4: Calculate the critical values
Using the Casio Calculator
DIST -> F -> InvF
Inputs:
Area: 0.05
n:df: 1
d:df: 3
Output:
10.128
Using R
qf(0.05,1,3,lower.tail = F)
Step 5: Decision
Reject H0 because test stat > critical value
Reject H0 because critical value < test stat
Using the sample data set pictured, how would you calculate the F test statistic for the regression model with the following hypothesis:
H0: β1=0 (there is no relationship between X and Y)
H1: β1≠0 (there is relationship between X and Y)
(Hint: up to step 3 of 5)

Step 1: State the hypothesis
H0: β1=0 (there is no relationship between X and Y)
H1: β1≠0 (there is relationship between X and Y)
Step 2: State the alpha. (Most commonly used is 0.05)
α=0.05
Step 3: Calculate the test statistic using the formula, reference the ANOVA summary.
MSR/MSE
- 104/14.565
- 257

Using the sample data set pictured, how would you calculate the T test statistics for the regression model with the following hypothesis:
H0: β1=0 (there is no relationship between X and Y)
H1: β1≠0 (there is relationship between X and Y)
(Hint: up to step 3 of 5)

Step 1: State the hypothesis
H0: β1=0 (there is no relationship between X and Y)
H1: β1≠0 (there is relationship between X and Y)
Step 2: State the alpha. (Most commonly used is 0.05)
α=0.05
Step 3: Calculate the test statistic using the formula
(B̂1−β1)/SB̂1
( 2.245 − 0 ) / 0.292
2.245 / 0.292
7.698
Where:
B̂<sub>1</sub>= Coefficient Estimate for X
β<sub>1</sub>= Hypothesis value being tested
SB̂<sub>1</sub>= Coefficient standard error estimate for X

Using the sample data set pictured, how would you calculate the T critical values for the regression model with the following hypothesis:
H0: β1=0 (there is no relationship between X and Y)
H1: β1≠0 (there is relationship between X and Y)
(Hint: up to step 4 of 5)
Based on our findings, would we reject or not reject the null hypothesis?

Step 1: State the hypothesis
H0: β1=0 (there is no relationship between X and Y)
H1: β1≠0 (there is relationship between X and Y)
Step 2: State the alpha. (Most commonly used is 0.05)
α=0.05
Step 3: Calculate the test statistic using the formula
(B̂1−β1)/SB̂1
( 2.245 − 0 ) / 0.292
2.245 / 0.292
7.698
Step 4: Calculate the critical values for T.
Using Casio calculator:
DIST -> t -> Invt
Inputs:
Area = α/2 (two-tailed test) = 0.025
df: n - 2 = 5 - 2 = 3
Outputs:
-3.1824 and 3.1824
Using R:
qt(.975,3) = 3.182446 or qt(.025,3) = -3.182446
Step 5: Decision
Reject H0 because test stat is outside of the range of critical values
What is the pictured formula used to derive?
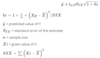
The prediction interval estimate for an individual y, given Xp.
Where Xp is the given value of X.
What is the picture formula used to derive?
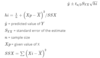
The confidence interval estimate for the mean value of y, given Xp.
Where Xp is the given value of X.
