Foundations of Scholarship Flashcards
Positive Likelihood Ratio
true positives/false positives
Negative Likelihood Ratio
False negative/true negatives;
SPIN and SNOUT
a SPecific test is good at ruling IN disease; a SeNsitive test is good at ruling OUT disease; If you get a negative test you can be sure that the person doesn’t have the disease.
SPIN and SNOUT
a SPecific test is good at ruling IN disease; a SeNsitive test is good at ruling OUT disease; If you get a negative test you can be sure that the person doesn’t have the disease.
Positive Predictive Value
Given you have a positive test, how likely it is that you have the disease. Depends on the pretest probability - the likelihood of having the disease to begin with.
Negative Predictive Value
Given you have a negative test, how likely it is that you don’t have the disease.
Post-test probability
What is the probability I have the disease given I have tested positive?
2x2 table for a diagnostic test

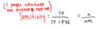
Calculation for Sensitivity
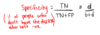
Calculation for Specificity
Probability of getting a negative test if you don’t have the disease. High specificity = low false positive rate.
Likelihood ratios
Likelihood ratios “indicate the extent to which a given diagnostic test result will increase or decrease the pretest probability of the target disorder.”
Can be used to change from pre-test to post-test probability using a nomogram.
Purpose of Fagan’s Nomogram
To determine posttest probability with known pretest probability and a likelihood ratio.
What is the difference between blinding and allocation concealment?
Not all trielas can be blinded, but in all cases allocation (of the next patient) can be concealed. Allocation concealment refers to the knowledge of the treatment to which the next patient is to be randomized.
Why is it the intention-to-treat analysis preferable?
- We randomize to create balance. As soon as we begin to remove randomized pts from the analysis, we counter that manipulation and open the trial to bias
- The p-value on the outcome is based on the assumption that patients are randomly assigned to treatment, and failure to include all pts as randomized violates that assumption. Note that we do calculate p-values in non-randomized studies but that is based on further unverifiable assumptions.
- ITT mimics the real world. For instance, we don’t expect every pt to be 100% compliant and some patients will be 0% compliant.
Intention-to-treat (ITT) analysis
We use ITT to prevent bias from occurring in our analysis
more…sarah emailed me notes
Downsides to intention-to-treat
Downsides:
- non-compliance in either group throws off the study. When we combine them with the people who were compliant, we water down the actual efficacy of the treatment.
*
Can you ignore missing data?
No. This violates the intent to treat approach. Missing data is not random, certain people are more likely to be lost to follow up than others.
Heterogeneity or non-heterogeneity
Heterogeneity refers to variation in methods included in the meta-analysis (or the way the included studies quantified the outcome?). If there is heterogeneity present, you need to use a randomized effects model for analysis. You can use da fixed effect model if there is no heterogeneity and this is preferred if you can use it because the confidence intervals are tighter.
clinical vs statistical heterogeneity?
heterogeneity influences the decision to perform a meta-analysis or not
What does the vertical line on a forest plot mean?
It means that RR = 1 and if the confidence intervals cross that line it indicates that the treatment may not yeild any difference in outcome. If your results are to the left, it favours treatment over no treatment.
I^2 statistics
Calculates the proportion of variation due to heterogeneity.
0% = no heterogeneity
90% = lots of heterogeneity, so the results of the analysis are almost meaningless
Define Systematic Review
“The application of strategies that limit bias in assembly, critical appraisal, and synthesis of all relevant studies on a specific topic. Meta-analysis may be, but is not necessarily, used as part of this process.”
Fixed effects models vs random effects models
Random effects models takes into account all of the random things that could have interfered. If you have a very strong significance with a random effects model, it is more likely to be even more significant with a fixed effects model because it maintains that significance even while accounting for random interference.
How to assess for heterogeneity
- Visually
- Q statistic - has a p value that indicates that heterogeneity is present if it is significant.
- I^2 statistic tells us the percent heterogeneity that exists
the issue with Q statistics is that they are often underpowered so they can suggest that there is no heterogeneity (insignificant p value) in cases where they are just underpowered and heterogeneity is in fact present.
PEO
Mostly for qualitative research designs.
Population
Exposure
Outcome
The major difference between descriptive and analytic studies
Analytic studies test a hypothesis.
What do the results of an odds ratio tell you?
OR =1 : exposure does not affect odds of outcome
OR >1 : exposure associated with higher odds of outcome
OR <1 : exposure associated with lower odds of outcome
What are sequential mixed methods designs
Quantitative → qualitative → interpretation : explanatory
Qualitative → quantitative → interpretation : exploratory
Before intervention (qualitative) → intervention (quantitative) → after intervention (qualitative) → interpretation: sequential embedded design
Cross-sectional study design
A snapshot of people with and without the disease and exposure.
Con: Assesses the possible cause and effect at the same time so not actually able to determine which came first - therefore unable to determine cause and effect relationships.
Pro: quick, cheap, easy, and can look at multiple variables
Case-control studies
Choose participants based on outcome status and then look back to see what exposures they had by asking directly or examining records. A retrospective design
Pro: food for rare diseases. Good for when exposure may be unethical to allocate in an RCT. Good for outbreak investigations.
Cons: Subject to recall bias. Confounding due to lack of similarity bt cases and controls (selection bias)
Cohort studies
Participants are selected based on their exposure status. Can be prospective, when the cohort is followed forward in time, or retrospective, where the cohort is selected from a database at a time in the past and then re-checked in the database at present time to see if they got the outcome.
Pros: Can assess cause and effect. Can study multiple outcomes of a single cause. Better evidence than a cross-sectional or case-controls tudy.
Cons: Prospective is slow and expensive. Not good for rare outomes. Prospective is subject to loss-to-follow-up.
Relative Risk
Used to measure association of categorical variables. Requires data on incidence, so can’t be performed for case-control studies.
Equation:
RR = [P(outcome|exposure)]/[P(outcome|no exosure)
RR = [a/(a+b)]/[c/(c+d)]
If RR = s, then the people with the exposure were 3x more at risk of experiencing the outcome compared to those without the exposure.
Odds Ratio
Basically the shitty version of RR that we do when we don’t have incidence data (i.e., we did a case-control study). It’s a good estimate of RR when the disease is rare.
OR = (a/b)/(c/d)
Attributable risk
Measure of the difference in disease risk between exposed and unexposed groups.
AR = (a/(a+b)) - (c/(c+d))
