Financial Mathematics Flashcards
What is Financial Mathematics?
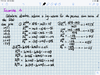
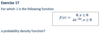
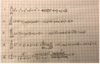
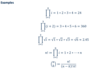
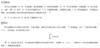
Exercise(s)1:Sums and products


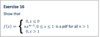
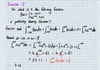
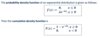
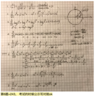
Exercise(s) 2
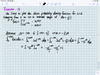
Exercise(s) 4
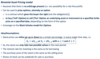
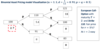
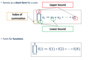
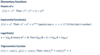
Sum symbol
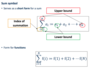
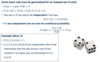
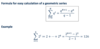
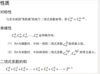
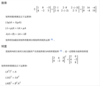
Formula for easy calculation of the sum of the first N integers (Gauss summation):

Formula for easy calculation of a geometric series
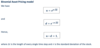
products symbol
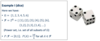
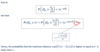
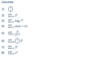
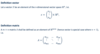
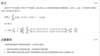
binomial coefficient:二项式系数,example中的最后一个
当下面的k=0时,二项式系数=1. n为自然数,k为整数。二项式系数对组合数学很重要,因它的意义是从n件物件中,不分先后地选取k件的方法总数,因此也叫做组合数。
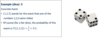
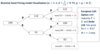
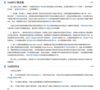
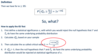
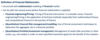
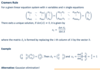
Binomial formula二项式
• Describes the algebraic expansion of powers of a binomial


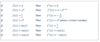
Elementary functions:基本功能
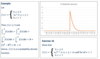
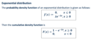
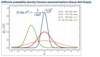
Exponential function:指数函数
Logarithm:对数
Trigonometric function:三角函数
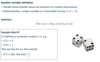
Definition vector
Definition matrix
Calculation rules for matrices
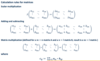
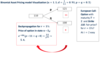
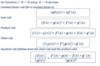
Determinant行列式
行列式展开的不同的方法

Cramer’s Rule:克莱默规则
Gaussian elimination:高斯消除
用最后的结果,代替变量的那一列来计算
Linear algebra加减
共轭

Linear algebra定义
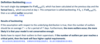
-The slope of the tangent at point X0 .
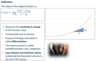
- Measures the sensitivity to change of the function value
- Fundamental tool of calculus
- Process of finding a derivative is called differentiation
- The reverse process is called antidifferentiation resp. integration
- Isaac Newton and Gottfried Leibniz independently discovered calculus in the mid-17th century
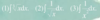
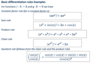
Basic derivatives
• Derivatives for some of the most common (/elementary) functions:
Basic differentiation rules Examples
Basic differentiation rules Examples
求导公式

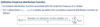
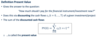
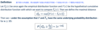
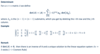
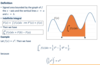
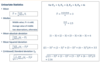
Integral calculus 积分微积分Definition
• Signed area bounded by the graph of f the x-axis and the vertical lines x=a and x=b.
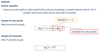
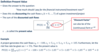
Indefinite Integral不定积分
中文定义
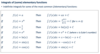
Integrals of (some) elementary functions
• Indefinite integrals for some of the most common (/elementary) functions:
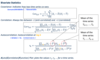
Calculation rules

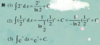
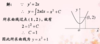
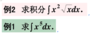
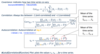
Exercise(s) 7:Integral calculus 积分

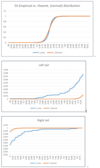
Basic statistics基本统计
Univariate Statistics单变量统计
odd:奇数
Mean Squared deviation:均方偏差
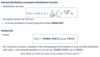
(Unbiased) Standard deviation: (无偏)标准偏差
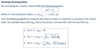
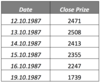
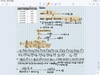
Bivariate Statistics双变量统计
Variations and combinations变化和组合
• How many ways of choosing elements out of a set of elements are there for different setups?