What steps would a typical enzyme kinetics experiment take?
Aim: to find the properties of a newly discovered enzyme by measuring KM and Vmax
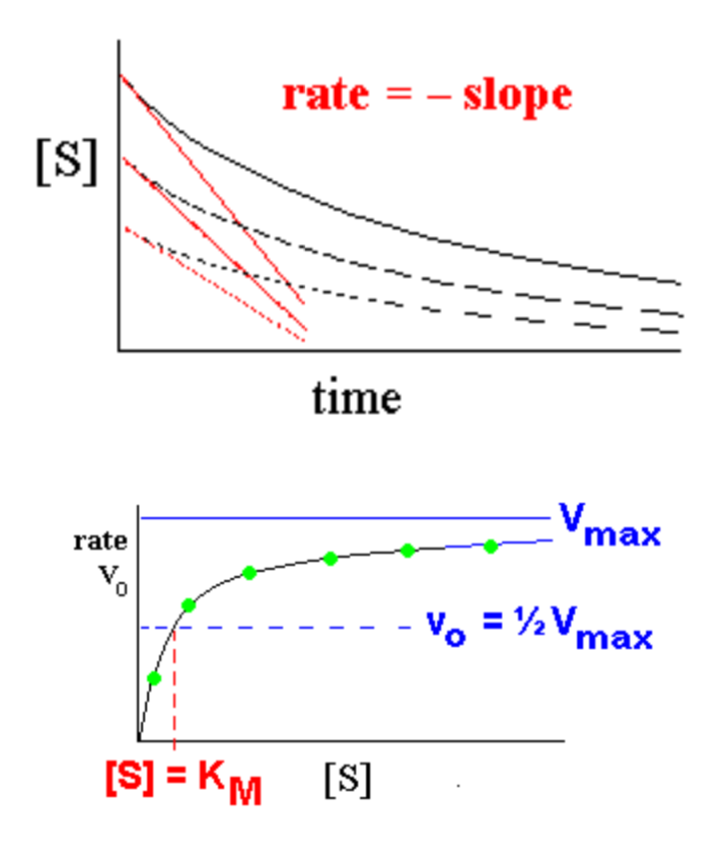
- Measure initial rates vo for a series of different [S] values
- Plot the Michaelis-Menten curve for the enzyme
- Find where vo = 0.5 Vmax at this point, [S] = KM
How does Km and Vmax tell us about enzymes properties?
- Vmax indicates the catalytic rate when 100% of the enzyme is occupied by substrate (saturated with substrate)
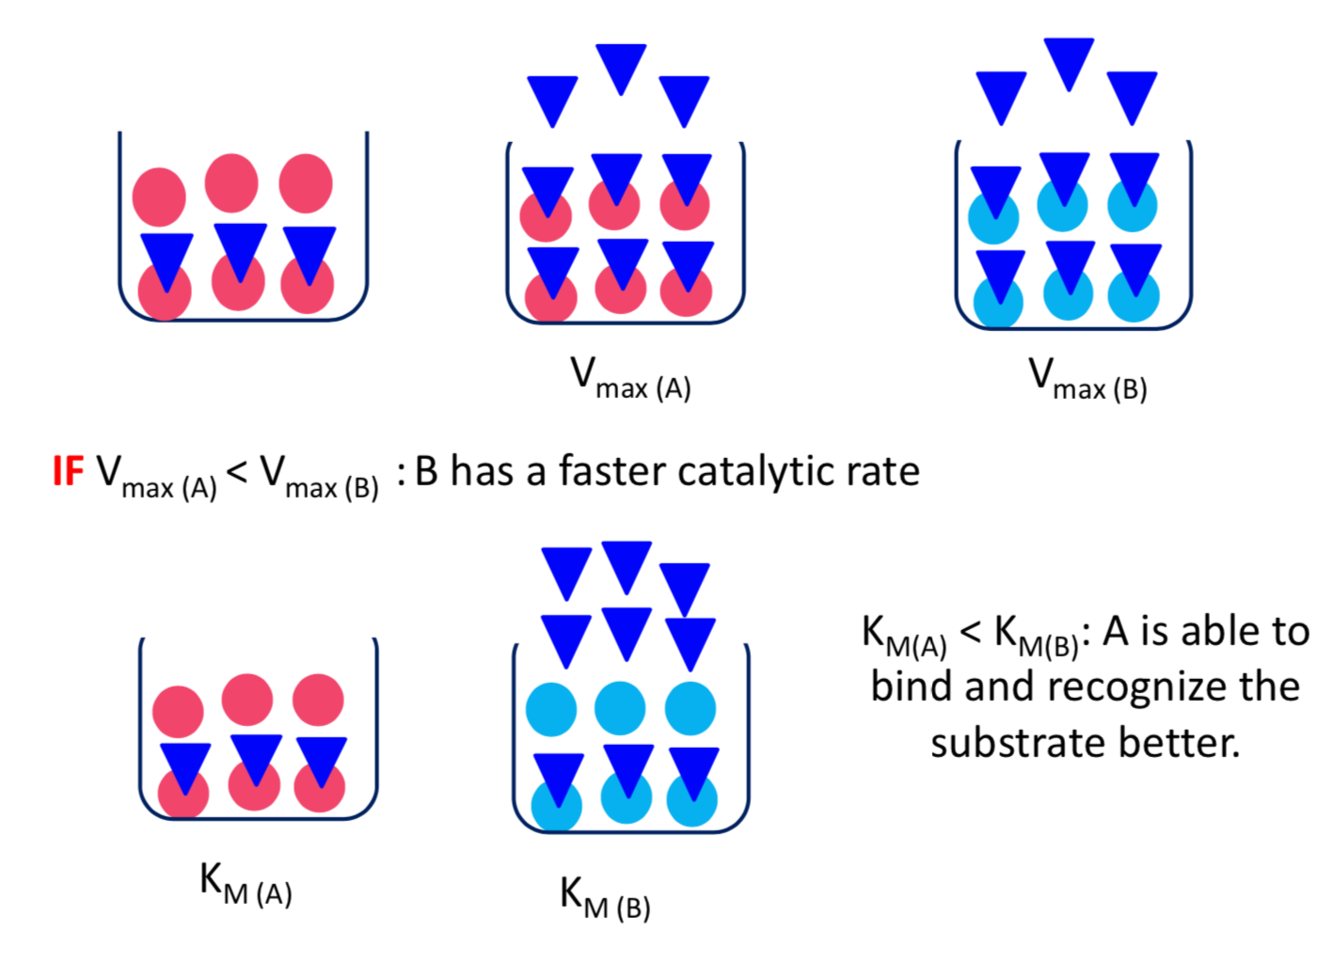
- higher Vmax means a faster reaction, better catalysis Vmax = k2 [E]total (Vmax is a conditional constant)
- KM indicates how well the substrate fits the catalytic site
- KM is the concentration of S that gives an initial rate of 0.5 Vmax
- low KM means good recognition, substrate binds well
- high KM means poor recognition, substrate binds poorly
- An enzyme with more than one substrate has a different KM value for each
- to measure KM(A), keep [B] constant and vary [A]
- to measure KM(B), keep [A] constant and vary [B]
What happens if Vmax(A)max(B)?
If KM(A)M(B)?
How do you measure Km and Vmax?
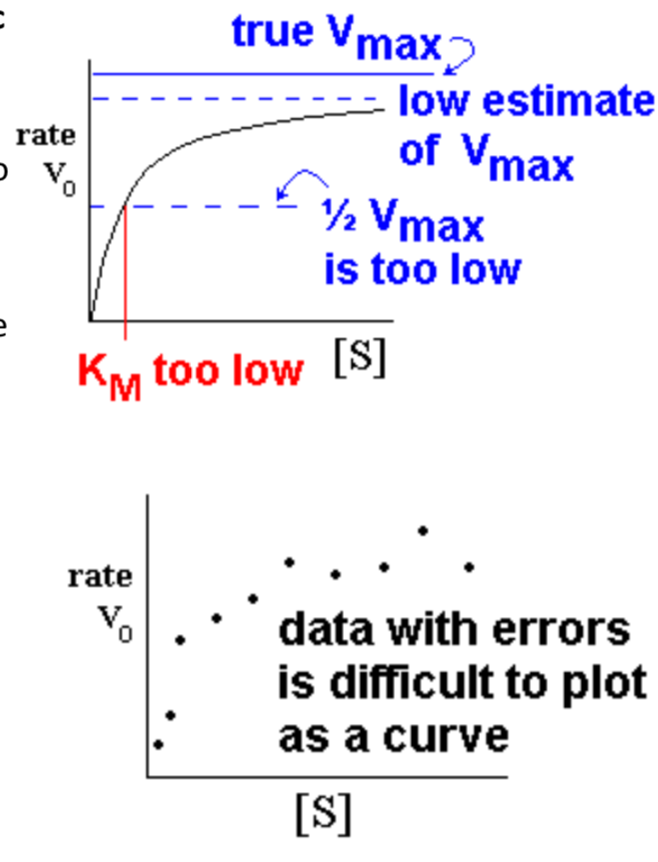
- The Michaelis-Menten equation is a hyperbolic curve when vo is plotted vs. [S]
- it approaches Vmax gradually
- when estimating by eye, the tendency is to underestimate Vmax, and then 0.5Vmax and KM are too low
- Real experimental data often shows scatter due to measurement errors
- difficult to plot a curve when points are scattered; easier to fit them to a line
- Linear transformation convert the Michaelis- Menten equation into a straight line form
- Lineweaver-Burk method
- Slopes and intercepts of the straight line give better estimates of Vmax and KM
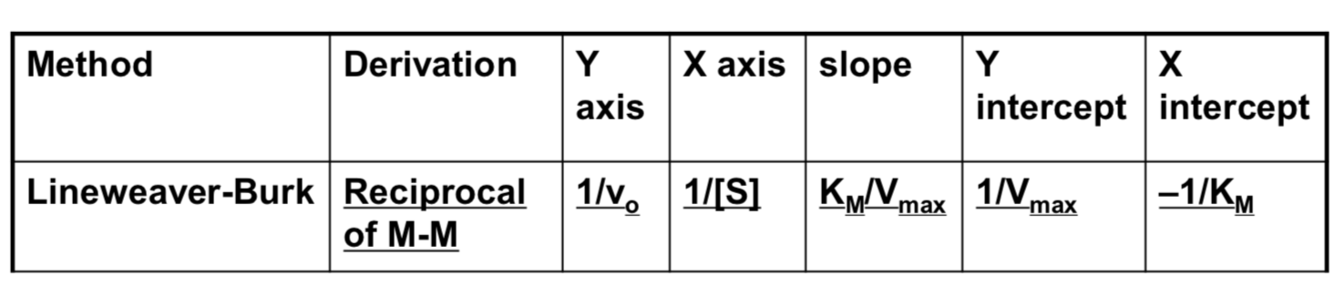
What is the Lineweaver-Burk or double reciprocal plot?
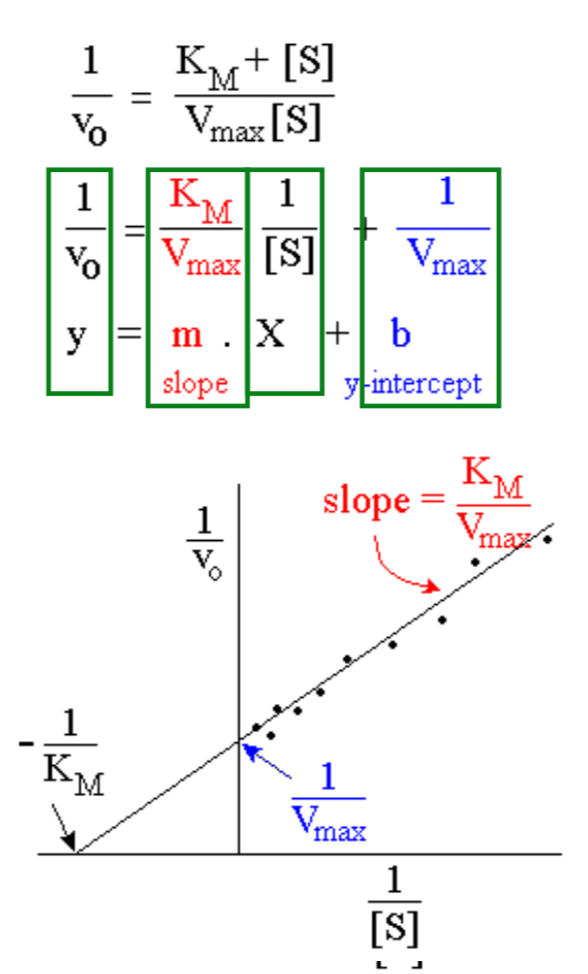
- Take reciprocals of both sides of the Michaelis-Menten equation
- Use 1/v0 for y and 1/[S] for x
- Result is a straight line equation
- Slope = KM/Vmax
- y-intercept = 1/Vmax
- x-intercept = -1/KM ( = -y intercept/slope)
- Obtain KM by extending the graph onto the negative x axis
- Lineweaver-Burk plots are widely used; they work well unless there are significant errors in the data
What is the summary of Lineweaver-Burk method for enzyme kinetic analysis?
Hints: You can easily derive the intercepts from the axes
Write Vmax in place of vo , and write -KM in place of [S]
slope = - y intercept / x intercept
What are inactivators?
Inactivators and inhibitors both interfere with enzyme catalysis
- Inactivators: usually react with enzymes irreversibly
- Inactivation results from covalent chemical reaction between inactivator and enzyme
- Often irreversible– reaction destroys catalytic activity and“uses up” the enzyme
- Simple stoichiometry relationship between inactivator and enzyme
2 μmol inactivator + 3 μmol enzyme = 1 μmol active enzyme left
- Many inactivators are higly toxic- nerve gases inactivate enzyme acetylcholinesterase, interfering with nervous impulses
What are inhibitors?
- Inhibitors: usually bind to enzymes reversibly
- Bound inhibitor decreases enzyme activity without destroying the catalytic function of enzyme molecule
- Enzyme activity is restored if inhibitor concentration is reduced
- non-covalent bonding- inhibitor binds to site on the enzyme by non-covalent forces, similar to substrate
- Degree of inhibition governed by binding equilibrium, not simple stoichiometry
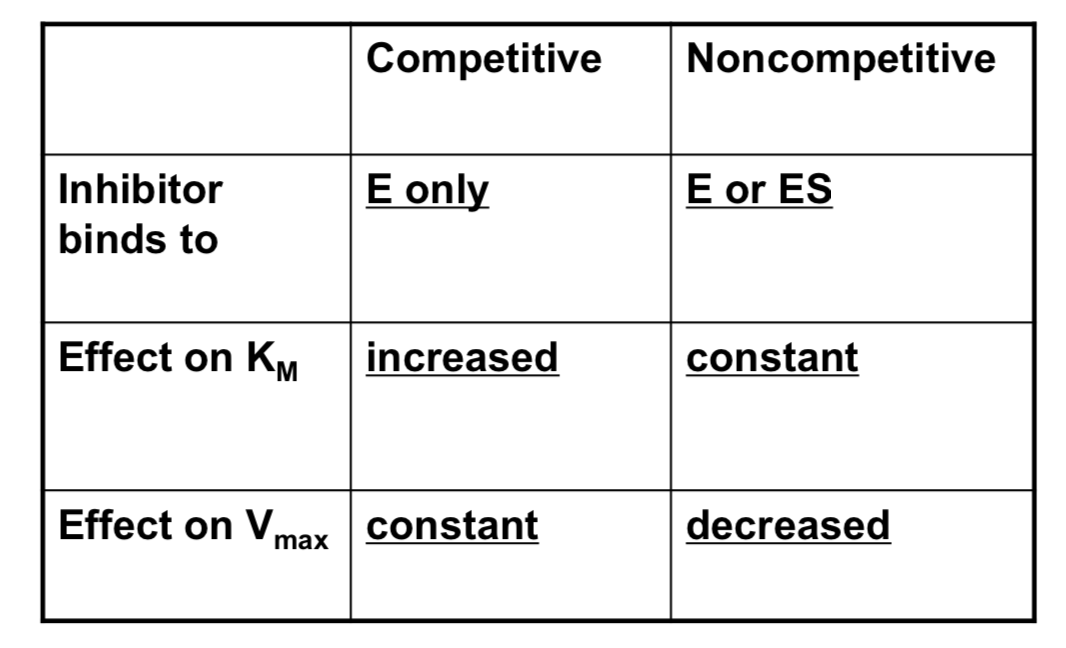
What is competitive and non-competitive inhibition?
- Presence of inhibitor may affect different stages of the catalytic reaction, gives different modes of inhibition
- competitive inhibition affects ability to bind substrate
- non-competitive inhibition affects catalytic rate (also mixed inhibition)
What do inhibitors regulate? How does it benefit us?
- Inhibitors can regulate enzyme activity in the cell
- More economical for cell to make and destroy a small inhibitor than a large enzyme
- Many drugs are enzyme inhibitors – focus of most drug company research
- Acetyl salicylic acid (aspirin) inhibits cyclo-oxygenase enzymes that make prostaglandins
- prostaglandins affect inflammatory response, blood pressure and blood clotting, and intestinal action
- research found replacements with fewer side effects; COX2 inhibitors - new pain killers, e.g. Celebrex
- Statins (e.g. Lipitor) inhibit a key liver enzyme involved in cholesterol biosynthesis (HMG CoA reductase), thus lowering blood cholesterol levels and heart attack risk
- Acetyl salicylic acid (aspirin) inhibits cyclo-oxygenase enzymes that make prostaglandins
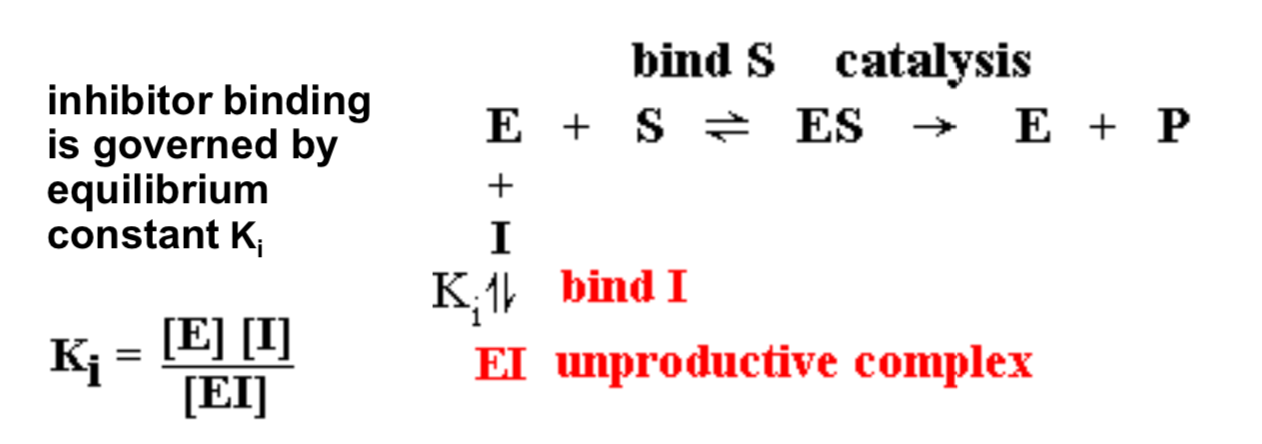
Competitive inhibition arises when inhibitors can only bind to what?
Competitive inhibition arises when the inhibitor can only bind to unoccupied enzyme E
- inhibitor binding is governed by equilibrium constant Ki
- Formation of EI complex means less E available to bind substrate
- Inhibitor and substrate compete for available enzyme – high [S] can overcome competitive inhibitor
- S and I often share same binding site and may resemble one another in terms of chemical structure
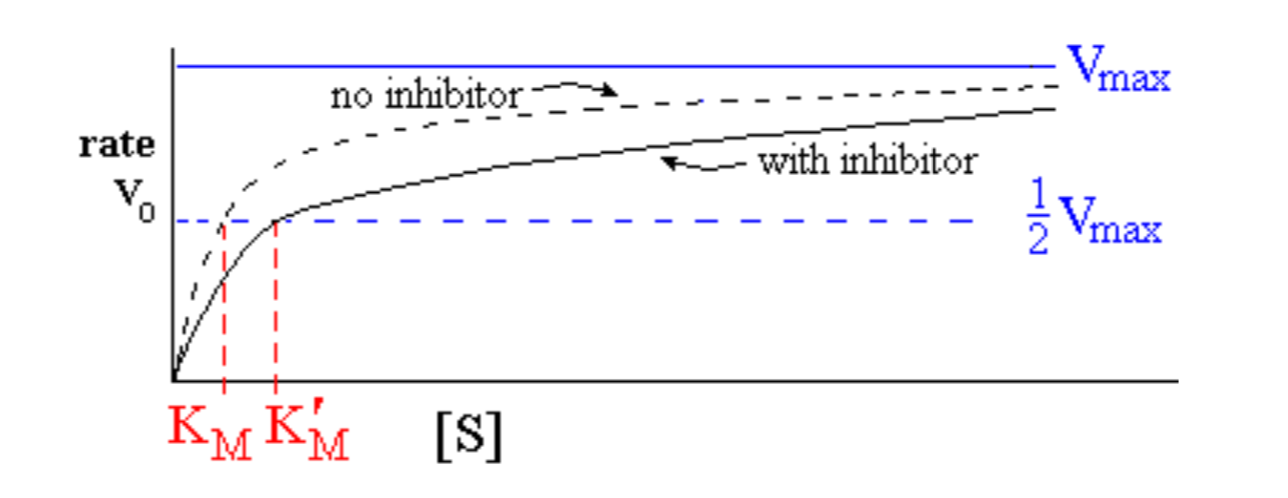
Enzyme behaviour in presence of competitive inhibitor:
effect of increasing [S] when [I] is held constant
- No effect on Vmax , but apparent KM is increased: KM’ = KM (1 + [I]/Ki)
- Inhibition factor = 1 + [I] / Ki (increases as [I] increases)
- Ki is a characteristic constant for each inhibitor (like KM)
- If [I] is set equal to Ki, KM’ = KM (1 + 1) = 2 KM
- Ki is the concentration of inhibitor [I] that causes KM to double
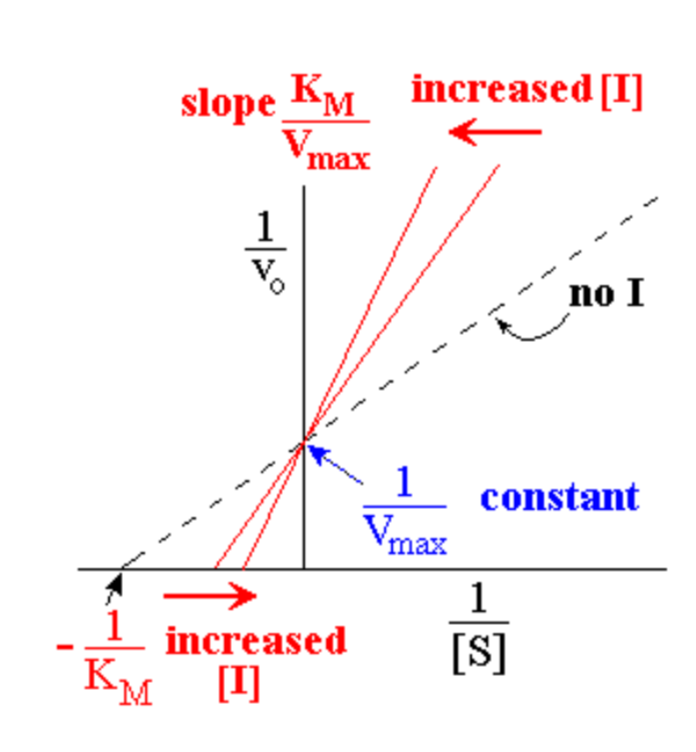
Competitive inhibition can be easily seen using what?
Competitive inhibition can be easily seen using a Lineweaver-Burk plot
- different lines represent different [I]
- no effect on Vmax , so all graph lines have same y intercept (y-int = 1/Vmax)
- KM’ increases as [I] increases, so x intercept gets smaller (x-int = - 1/KM’)
- slope increases as [I] increases; L-B slope = KM‘/Vmax
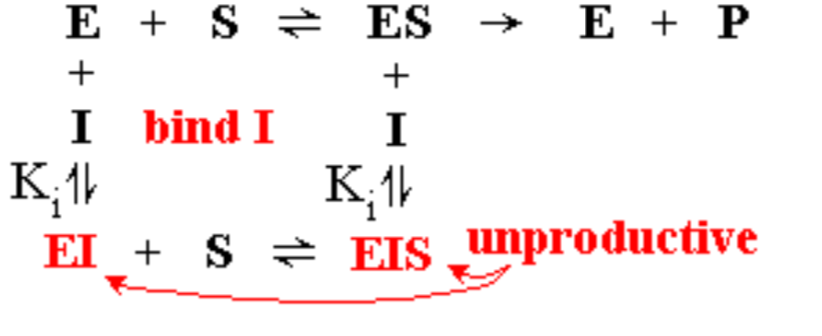
When does non-competitive inhibition arise?
- Non-competitive inhibition arises when inhibitor can bind to both E and ES
- inhibitor binding is governed by equilibrium constant Ki
- Formation of EI and EIS means less ES to undergo catalysis, but substrate can still bind to EI without yielding product
- Inhibitor binding site is different from substrate binding site
- Bound inhibitor may disorganize the catalytic component of enzyme
- If EI and EIS steps each have a different Ki, get mixed inhibition
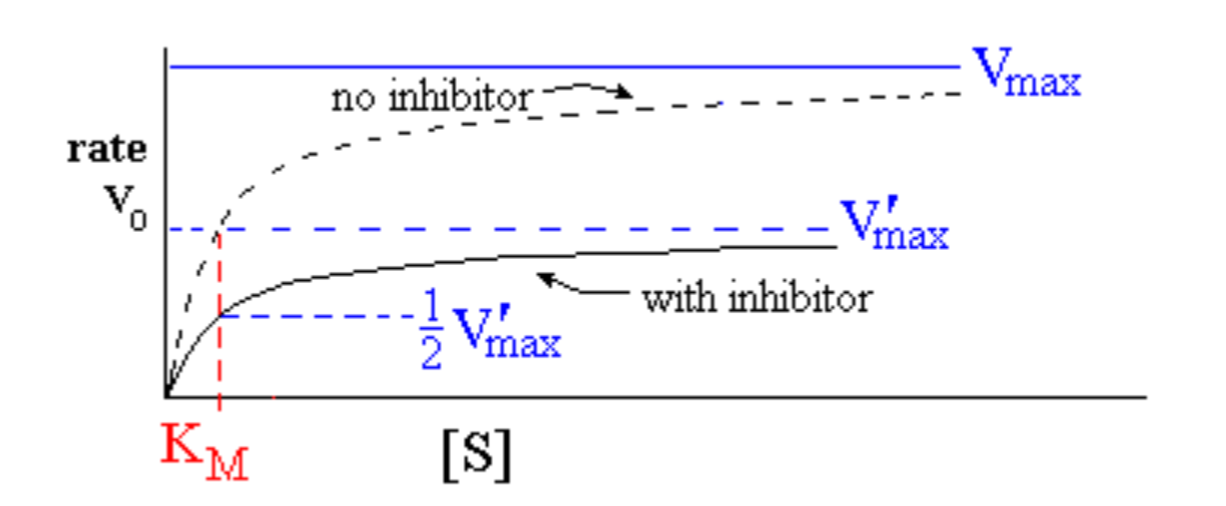
Enzyme behaviour in the presence of non-competitive inhibitor:
effect of increasing [S] when [I] is held constant
- V’max decreases as [I] increases: V’max = Vmax / (1 + [I] / Ki)
- KM is unchanged (mixed inhibition may show a small effect)
- If [I] is set equal to Ki, inhibitation factor = (1+1) =2
Ki is the concentration of inhibitor [I] that causes Vmax to halve
Non-competitive inhibition can be easily seen using what?
- different lines represent different [I]
- no effect on KM, so all graph lines have same x intercept (x-int = -1/KM)
- V’max decreases as [I] increases, so y intercept gets bigger (y int = 1/ V’max)
- Slope increases as [I] increases;
L-B slope = KM/ V’max
- For mixed inhibition, lines meet above the x-axis

What is the summary of inhibition effects?
- KM is increased by multiplying by (1 + [I] / Ki)
- Vmax is decreased by dividing by (1 + [I] / Ki)
- For mixed inhibition, both Vmax and KM change
-
Molecules and Amino Acids46
-
Amino Acid Analysis/ Protein Analysis34
-
Determining amino acid sequence of a protein15
-
Protein secondary structure18
-
Tertiary structure and protein stability19
-
Protein binding & recognition: Chemical basis of enzyme catalysis16
-
The catalytic mechanism of chymotrypsin & measuring activity22
-
Enzyme kinetics & The Michaelis-Menten Equation15
-
Experimental enzyme kinetics; Linear plots and Enyzme Inhibition17
