Biostatistics Flashcards
How is the sensitivity of a test defined?
What are highly sensitive tests used for clinically?
Sensitivity - ability of a test to detect disease
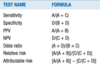
Mathematically: # of true positives divided by the number of people with the disease.
Tests with high sensitivity are used for disease screening.
False-positive results occur, but the test does not miss many people with the disease (low false-negative rate).
How is the specificity of a test defined?
What are highly specific tests used for clinically?
Specificity - ability of a test to detect health (or nondisease)
Mathematically: # of true negatives divided by the number of people without the disease
Tests with high specificity are used for disease confirmation.
False-negative results occur, but the test does not call anyone sick who is actually healthy (low false-positive rate).
The ideal confirmatory test must have high sensitivity and high specificity; otherwise, people with the disease may be called healthy
Explain the concept of a trade-off between sensitivity and specificity.
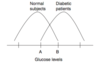
changing the cutoff value in screening tests (or changing the value of any of several screening tests) will change the number of true- and false-negative as well as true- and false-positive results.
- If the cutoff glucose value is raised, fewer people will be called diabetic (more false-negatives, fewer false-positives)
- If the cutoff glucose value is lowered, more people will be called diabetic (fewer false-negatives, more false-positives)
Define positive predictive value (PPV). On what does it depend?
When a test is positive for disease, the PPV measures how likely it is that the patient has the disease (probability of having a condition, given a positive test).
PPV is calculated mathematically by dividing the number of true-positive results by the total number of people with a positive test.
PPV depends on the prevalence of a disease (the higher the prevalence, the higher the PPV) and the sensitivity and specificity of the test (e.g., an overly sensitive test that gives more false-positive results has a lower PPV).
Define negative predictive value (NPV). On what does it depend?
When a test comes back negative for disease, the NPV measures how likely it is that the patient is healthy and does not have the disease (probability of not having a condition, given a negative test).
It is calculated mathematically by dividing the number of true-negative results by the total number of people with a negative test.
NPV also depends on the prevalence of the disease and the sensitivity and specificity of the test (the higher the prevalence, the lower the NPV). In addition, an overly sensitive test with lots of false-positive results makes the NPV higher.
Define attributable risk. How is it measured?
Attributable risk is the # of cases of a disease attributable to one risk factor (in other words, the amount by which the incidence of a condition is expected to decrease if the risk factor in question is removed).
Example, if the incidence rate of lung cancer is 1/100 in the general population and 10/100 in smokers, the attributable risk of smoking in causing lung cancer is 9/100
Ca incidence in smokers - Ca incidence in general population = incidence of Ca attributed to smoking
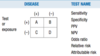
Given the 2 × 2 table below, define the formulas for calculating the following test values
Define relative risk. From what type of studies can it be calculated?
What is a clinically significant value for relative risk?
Relative risk compares the disease risk in people exposed to a certain factor with the disease risk in people who have not been exposed to the factor.
Relative risk can be calculated only after prospective or experimental studies; it cannot be calculated from retrospective data.
- If a question asks you to calculate the relative risk from retrospective data, the answer is “cannot be calculated” or “none of the above.”
Any value for relative risk other than 1 is clinically significant.
- If the relative risk is 1.5, a person is 1.5 x more likely to develop the condition if exposed to the factor in question.
- If the relative risk is 0.5, the person is only half as likely to develop the condition when exposed to the factor; in other words, the factor protects the person from developing the disease.
Define odds ratio. From what type of studies is it calculated?
What is a clinically significant value for odds ratio?
OR attempts to estimate relative risk with retrospective studies (remember that relative risk can be calculated only from prospective or experimental studies; not from retrospective studies). OR compares the
- incidence of disease in persons exposed to the factor and
- incidence of nondisease in persons not exposed to the factor with the
- incidence of disease in persons not exposed to the factor and
- incidence of nondisease in persons exposed to the factor
to see whether there is a difference between the two.
As with relative risk, values other than 1 are significant.
What do you need to know about standard deviation (SD) for the USMLE?
You need to know that with a normal or bell-shaped distribution:
- 1 SD holds 68% of the values
- 2 SD hold 95% of the values
- 3 SD hold 99.7% of the values
Define mean, median, and mode.
Mean is the average value
Median is the middle value once all the values are lined up
Mode is the most common value
What is a skewed distribution?
How does it affect mean, median, and mode?
A skewed distribution implies that the distribution is not normal; in other words, the data do not conform to a perfect bell-shaped curve. Because they are not normal distributions, SD and mean are less meaningful values.
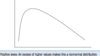
Positive skew is an asymmetric distribution with an excess of high values, in other words, the tail of the curve is on the right (mean > median > mode) (Fig. 3-2).
Negative skew is an asymmetric distribution with an excess of low values, in other words, the tail of the curve is on the left (mean < median < mode).
Define test reliability.
How is it related to precision?
What reduces reliability?
Reliability measures the reproducibility + consistency of a test; synonymous with precision.
- For example, if the test has good interrater reliability, the person taking the test will get the same score if two different people administer the same test.
Random error reduces reliability and precision (e.g., limitation in significant figures).
Define test validity.
How is it related to accuracy?
What reduces validity?
Validity measures the trueness of measurement, in other words, whether the test measures what it claims to measure; synonymous with accuracy
- For example, if you give a valid IQ test to a genius, the test should not indicate that he or she is challenged. Systematic error reduces validity and accuracy (e.g., when the equipment is miscalibrated).
Define correlation coefficient.
What is the range of its values?
A correlation coefficient measures to what degree two variables are related. The value of the correlation coefficient ranges from −1 to +1.
True or false: A correlation coefficient of −0.6 is a stronger correlation coefficient than +0.4
True.
To determine the strength of the relationship between two variables, look at the distance of the value from zero.
- 0 correlation equals no association whatsoever; the two variables are totally unrelated.
- 1 equals a perfect positive correlation (when one variable increases, so does the other)
- 1 equals a perfect negative correlation (when one variable increases, the other decreases).
Therefore, use the absolute value to give you the strength of the correlation (e.g., −0.3 is equal to +0.3).
Define confidence interval. Why is it used?
A confidence interval of 95% says that you are 95% confident that the mean of the entire population is within a certain range (usually two SD of the mean).
For example, if you sample the heart rate of 100 people and calculate a mean of 80 beats per minute and a standard deviation of 2, your confidence interval (also known as confidence limits) is written as 76 < X < 84 = 0.95. In other words, you are 95% certain that the mean heart rate of the whole population (X) is between 76 and 84 (within 2 SD of the mean).
What five types of studies should you know for the Step 2 exam?
- Experimental studies.
- Prospective studies.
- Retrospective studies.
- Case series.
- Prevalence surveys.
PREP for Ck
What is an experimental study?
gold standard
Compares 2 equal groups in which one variable is manipulated and its effect is measured.
Use double-blinding (or at least single-blinding) and well-matched controls to ensure accurate data.
It is not always possible to do experimental studies because of ethical concerns.
What are prospective studies?
Why are they important?
What can you use them to calculate?
involves choosing a sample, dividing it into two groups based on the presence or absence of a risk factor, and then following the groups over time to see what diseases they develop
You can calculate relative risk and incidence from this type of study.
Prospective studies are time-consuming and expensive, but are practical for common diseases.
What are retrospective studies?
Discuss their advantages and disadvantages
Retrospective (case-control) studies choose population samples after the fact, based on the presence (cases) or absence (controls) of disease.
- Advantages: Risk factors can be assessed, can calculate an odds ratio, less expensive, less time-consuming, and more practical for rare diseases.
- Disadvantages: cannot calculate a true relative risk or measure incidence.
What is a case series study?
How is it used?
A case series study simply describes the clinical presentation of people with a certain disease.
Good for extremely rare diseases (as are retrospective studies) and may suggest a need for a retrospective or prospective study.
What is a prevalence survey? How is it used?
Prevalence (cross-sectional) surveys look at the prevalence of a disease and its risk factors to assess possible causes of a disease.
The hypothesis can then be tested with a prospective study.
What is the difference between incidence and prevalence?
Incidence number of new cases of a disease in a certain unit of time (generally 1 year, but any time frame can be used). The incidence of a disease is equal to the absolute (or total) risk of developing a condition (as distinguished from relative or attributable risk).
Prevalence total number of cases of a disease (new or old) at a certain point in time.
If a disease can only be treated to the point that people can be kept alive longer without being cured, what happens to the incidence and prevalence of the disease?
Nothing happens to the incidence (the same number of people contract the disease every year), but the prevalence will increase because people with the disease live longer.
In short-term diseases (e.g., influenza), the incidence may be higher than the prevalence, whereas in chronic diseases (e.g., diabetes, hypertension), the prevalence is greater than the incidence.
Define epidemic
observed incidence greatly exceeds the expected incidence
When do you use a chi-squared test, t-test, and analysis of variance test?
All of these tests are used to compare different sets of data:
- Chi-squared test: Compares percentages or proportions/fractions (nonnumeric or nominal data).
- t-test: Compares two means.
- Analysis of variance (ANOVA): Compares three or more means.
What is the difference between nominal, ordinal, and continuous types of data?
Nominal data have no numeric value; for example, the day of the week.
Ordinal data give a ranking but no quantification; for example, class rank, which does not specify how far number 1 is ahead of number 2.
Continuous data is mostly numerical measurements; for example, weight, blood pressure, and age.
This distinction is important:
- Chi-squared tests must be used to compare ordinal or nominal data (CON)
- t-test or ANOVA test is used to compare continuous data (TAC)
CONTACt
Define P-value.
What three points about P-value should be remembered for the exam?
If P < 0.05, there is a < 5% chance that the data was obtained by random error or chance; if P < 0.01, the chance is less than 1%.
- A study with a P-value < 0.05 may still have serious flaws.
- A low P-value does not imply causation.
- A study that has statistical significance does not necessarily have clinical significance.
- For example, if drug X can lower blood pressure from 130/80 to 129/80 mm Hg with P < 0.0001, you will not use drug X because the result is not clinically important given the minimal blood pressure reduction, the cost, and potential side effects.
Explain the relationship of the P-value to the null hypothesis.
P-value represents the chance of making a type I error - claiming an effect or difference when none exists, or rejecting the null hypothesis when it is true.
For example, in a study of HTN, the null hypothesis says that the drug under investigation does not work; therefore, any difference in BP is because of random error or chance. When the drug works beautifully and lowers BP by 60 points, the null hypothesis must be rejected because clearly the drug works.
When P < 0.05, I can confidently reject the null hypothesis because the P-value tells me that there is less than a 5% chance that the null hypothesis is correct. If the null hypothesis is wrong, the difference in blood pressure is not caused by chance; therefore, it must be because of the drug.
What is a type I and II error?
Type I error: claiming an effect or difference when none exists, or rejecting the null hypothesis when it is true.
Type II error: null hypothesis is accepted when in fact it is false
What is the power of a study? How do you increase the power of a study?
Power measures the probability of rejecting the null hypothesis when it is FALSE (a good thing).
The best way to increase power is to increase the sample size.
What are confounding variables?
Confounding variables are unmeasured variables that affect the independent (manipulated, experimental) AND dependent (outcome) variables.
For example, an experimenter measures the number of ashtrays owned with the incidence of lung cancer and finds that people who have lung cancer have more ashtrays. He concludes that ashtrays cause lung cancer. Smoking tobacco is the confounding variable because it causes the increase in ashtrays and lung cancer.
Discuss nonrandom or nonstratified sampling.
Non-random sampling: some elements of the population have no chance of selection, or where the probability of selection cannot be accurately determined.
Non-stratified sampling: entire study is considered to be one unit and is sampled in a systematic or random manner
For example: City A and city B can be compared, but they may not be equivalent. If city A is a retirement community and city B is a college town, city A will have higher rates of mortality and heart disease if the groups are not stratified into appropriate age-specific comparisons.
What is nonresponse bias?
Occurs when people do not return printed surveys or answer the phone in a phone survey. If nonresponse accounts for a significant percentage of the results, the experiment will suffer.
Explain lead-time bias.
Lead-time bias is caused by time differentials.
The classic example is a cancer screening test that claims to prolong survival compared with older survival data, when in fact the difference is only due to earlier detection—not improved treatment or prolonged survival.
Explain admission rate bias. Example?
aka Berkson’s paradox - concept underlying this bias is that patients with >1 disease/condition are more likely to be hospitalized than patients with only one disease/condition
The classic example occurs when an experimenter compares the mortality rates for MIs (or some other disease) in hospitals A and B and concludes that hospital A has a higher mortality rate. The higher rate may be caused by tougher admission criteria at hospital A, which admits only the sickest patients with MI. Hence, hospital A has higher mortality rates, although its care may be superior.
The same bias can apply to a surgeon’s mortality and morbidity rates if he or she takes only tough cases.
Explain recall bias. Which type of study is this most susceptible to this risk?
When people cannot remember exactly, they may inadvertently overestimate or underestimate risk factors.
Risk in all retrospective studies.
Explain interviewer bias.
The scientist receives big money to do a study and wants to find a difference between cases and controls. Thus he or she inadvertently calls the same patient comment or outcome “not significant” in the control group and “significant” in the treatment group.
occurs in the absence of blinding.
What is unacceptability bias?
Unacceptability bias occurs when people do not admit to embarrassing behavior, claim to exercise more than they do to please the interviewer, or claim to take experimental medications when they spit them out.
