QSAR Flashcards
Quantitative Structure-Activity Relationship
- What are they
- Molecular Geometry
- 3D structure optimisation
- Molecular descriptors
- The process of QSAR analysis
QSAR- the principle
- You have at your disposal a set of existing compounds where the biological activity has already been measured
- How can you use this information to decide which compounds to make and test next
- draw the structures of the compounds and optimise their 3D geometries
- Calculate molecular properties
- Use the descriptors together with the biological data to derive equations that predict the biological activity
- Calculate the descriptors for new compounds and use the equation to predict their biological activities
Important note
- QSAR does not require any knowledge of the receptor, active site or mechanism of action
- Only the structure of a set of compounds of known biological activity are required
- It is necessary, however, that the compounds all act in the same way at the same receptor or active site

General procedure
- Select a set of molecules interacting with the same receptor with known activities =>
- Calculate features (e.g. physicochemical properties)
- Divide the set into 2. One for testing and on for training
- Training set: Build a model- find the mathematical relationship between the activities and properties
- test the model on the test dataset
- Testing set:
Preparation of the structures (structures of known biological activity)
- Draw the compounds
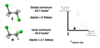
- Clean up the structure of performing a molecular mechanics geometry optimisation
- Change the geometry to minimise the energy of the molecule
- Identify key rotatable bonds and perform a conformation search**
- Perform a semi-empirical quantum mechanical (calculate energy difference once the confirmation has occurred- if the energy lowers it is more correct) geometry optimisation on the lowest energy conformation identified in step 3
- NB** see molecular mechanisms geometry optimisation
Molecular mechanics geometry optimisation
- Considers atoms as balls and bond as springs
- Does not consider the electrons
- Fast
- Low quality but OK for a quick clean up of a drawn structure
Semi-Empirical quantam mechanical geometry optimisation
- The valence electrons (outer shell- governs bonding of the molecule) are used to construct molecular orbitals
- The inner electrons are approximated via a parameter set
- Slower than MM (molecular mechanics) but much better quality
- Several hours per molecule
Why is conformation important
- At room temperature, the lowest energy conformer prevails
- We want the molecular properties to be calculated from a relevant conformation
*
Which conformation should be used
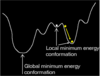
- All energy minimisation techniques concentrate on searching downhill- they therefore tend to find the nearest local minimum on the energy surface
- If a much deeper (i.e. better) energy minimum is nearby, but separated from the starting point by a high energy barrier, it will not be found
- Energy minimization is therefore not capable of finding the global energy minimum. Therefore we must use conformation searching
- NB- most drugs conformation they have when they are active tend to be the same as those in the global minimum energy conformation
Conformation searching
- Each rotatable in turn bond is stepped round in small increments and the energies of the resulting conformations are calculated
- This is used to find the approximate position of the GLOBAL MINIMUM ENERGY POTENTIAL WELL
- After that a high quality energy-minimisation technique can be used to refine the structure down to the global minimum energy conformation (E.g. Semi-empirical quantum mechanical geometry optimisation)
Conformation searching- Exhaustive searching of rotatable bonds
- Conformational explosion
- 1 rotatable bond/ 5 steps => 72 conformations
- 2 rotatable bonds/ 5 steps => 5184 conformations (722)
- 8 rotatable bonds/ 5 steps => 722204136208736 (728)
- Potential energy surface from 2 search labels
- Cannot be done for drugs with many rotatable bond due to the large amount of time it would take to complete
- Input the 3D structure
- Align the molecules about their common core (because some properties are vectorised)- define what the core is
- Add the biological activity
- Calculate the molecular descriptors
- Use multiple regression analysis to derive an equation relating the biological activity to the calculated properties
Molecular descriptors- examples DONT NEED TO REMEMBER ALL OF THESE

Molecular descriptors- examples
- Consititutional
- Geometrical
- Topological
- Electrostatic
- Quantum-chemical
- Miscellaneous
- Solubility
- Electronic
- Lipophilic
- Steric

Molecular descriptor- examples

Molecular descriptors-
- Some descriptors can be calculated rapidly e.g. MW, dimensions
- Other descriptors may be time-consuming to calculate such as those derived from Quantum mechanics (Anything that involves electrons)
- HOMO-LUMO energy gap
- Polarisability
- Partial atomic charge
- Some descriptors have an obvious experimental counterpart with which the calculation can be compared e.g. partition co-efficient
- Other descriptors refer to properties of the whole molecule; others refer to the properties of individual atoms
- New descriptor - modern software packages allow you to generate hundreds or even thousands descriptor. Not all of them are useful, for examples dragon provides 1664 mol descriptors
Molecular descriptors 2D and 3D
- Some descriptors may be calculated from the 2D structure whilst others require the 3D structure
- If a 3D structure is required then which molecular conformation should be adopted => Usually the global minimum energy conformation
- Some descriptors such as lipole, dipole, moments of inertia have components along the orthogonal x,y,z axes (i.e. they are vectors)
- Thus to compare the values from one molecule to another, each molecule in the set must be orientated in the same way

Molecular descriptors 2D and 3D- definition
- Mass- the molecular mass is calculated assuming that the various atomic isotopes occur in their common proportions
- Surface area- connolly surface area- probe radius of 1.4Å
- Volume- the volume within the surface area defined by the van der waals radii of the atoms
Molecular descriptors 2D and 3D
Moments of inertia and ellipsoid volume
- A measure of the distribution of mass within a molecule
- The moments of inertia and prinicipal axes of inertia for a molecule are calculated using the inertia tensor
- These results are reported in TSAR as moment 1 size, moment 1 length
- The volume defined by these values is calculated and reported as the ellipsoid volume
- You can view the molecule and an ellipsoid of inertia
- The ellipsoid’s prinipal axes are aligned with the aces of the inertia tensor. The length of each axis is inversely proportional to the moment of inertia around that axis
- The resulting ellipsoid is then scaled so that the atom furthest from the centre of gravity of the molecule appears on the ellipsoid surface
Molecular Descriptors 2D and 3D
LogP
- Lipophillicity is a measure of the ability of the molecules to move between fat and water
- It is often used to indicate how easily a molecule may be transported across membranes
- Most people use the partition co-efficient for water/octanol (LogP) as an estimate of lipophillicity
- Atomic values or substituent values are available from a databaser of experimentally determined values
- The values for the appropriate atomic or substituent fragments are simply added together to derive the molecular LogP value
Molecular Descriptors 2D and 3D
Molar refractivity
- This is compiled by reference to a database of experimentally determined values- substituent contributions and atomic contributions to molecular molar refractivity values
- MR often shows a strong correlation with ligand binding
- Both LogP and MR increase with alkyl chain length, so log P and MR show a strong correlation
- Polar functional groups increase MR, but decrease logP. Perhaps MR is a measure of non-lipophilic interactions, while logP is a measure of lipophilic interactions
- MR has a strong correlation with the molecular polarisability
Molecular Descriptors 2D and 3D
Polarizability
- A measure of the ease with which the electron cloud of the molecule can be distorted by an applied electric field
- The attractive part of the van der Waals interaction is a good measure of the polarisability
- Highly polarisable molecules can be expected to have strong attractions with other molecules
- The polarisability of a molecule can also enhance aqueous solubility
Molecular Descriptors 2D and 3D
Dipole moment
- Dipole moment calculations use partial charge information
- Total dipole moment for whole molecules and substituents are calculated using the centre of charge as an origin, and are in Debye units

Molecular Descriptors 2D and 3D
Lipole
- The lipole of a molecular is a measure of the lipophilic distribution
- It is calculated from the summed atomic logP values, as dipole is calculated from the summed partial charges of a molecule
- The total lipole for whole molecules and substituents is calculated using the centre of logP as an origin


