Lecture 8-Births, deaths and survival: Life history and life tables Flashcards
What does the equation Nt+1= Nt+B-D+I-E assume?
-that all individuals have same birth and death rates, same probability of dying -in reality, these things change with age of the individual, population density and e.g. weather -so quantify the lifecycle of the species and transitions from one life stage to the next
What should we consider into the equation for Nt?
-How long lived the organisms are. -When are they active (winter/summer) -how often do they reproduce -how long is each stage in the lifecycle = how do all these vary between species, environments, densities…
What does semelparous mean?
-grow, reproduce, die -big bang reproduction (lot of offspring) (salmon)
What does iteroparous mean?
-grow, reproduce again and again and eventually die= humans
What is ephemeral?
-they take advantage of special conditions, only grow in water, winter or summer etc.
What do annuals do?
-active throughout the year
What are life tables used for?
-Life tables are used to describe age-specific mortality and survival rates for a population. When this information is combined with fecundity data, life-tables can be used to estimate rates of population change -shows for each age the probability that the individual will die before the next birthday, probability of one surviving to particular age -remaining life expectancy for individuals at different ages
What are the three types of life tables? (name only)
- cohort or age-specific
- static= time specific
- composite=both
What is a cohort or age specific life table(dynamic)?
- data are collected by following a cohort throughout its life. This is rarely possible with natural populations of animals.
- horizontal, age specific
What is a cohort?
-a cohort is a group of individuals all born during the same time interval.
What is a static or time specific life table?
- age-distribution data are collected from a cross-section of the population at one particular time or during a short segment of time, such as through mortality data. Resulting age-specific data are treated as if a cohort was followed through time (i.e., the number of animals alive in age class x must be less than alive in age class x-1). Because of variation caused by small samples, data-smoothing techniques may be required -show the probability of death in the current year -assume that the death rate is constant= big assumption
- vertical, time specific
What is a composite life table?
-data are gathered over a number of years and generations using cohort or time-specific techniques. This method allows the natural variability in rates of survival to be monitored and assessed
What’s the first column in a life table?
-a list of the age classes (some cases= life stages)
What is the second column in a life table?
-the raw data collected for how many individuals survive to the beginning of each age class
What is in the third column of a life table?
lx -the proportion of the original cohort surviving to the beginning of that age class -shown as proportion or percentage
How do you calculate lx?
-take the number surviving in the age class and divide by the whole cohort (the original number started with) -if we had 100 individuals in the beginning and in this age class 10 survived= 10/100= 0.1 or 10%
What is the fourth column of a life table?
dx -the percentage of originals dying
How do you calculate dx?
- lets say have 843 in class 1 and 722 in class 2 -the number of individuals who died= 843-722=121 -the percentage of dying= 121/843= 14.3 -this dx goes into the line where we have 843 individuals as it’s out of those these died and it shows how many out of each class die
What is in the fifth column of a life table?
-qx -mortality rate -the proportion of individuals dying out of the population not the originals!
How do you calculate qx?
-lets say we have 722 individuals in class 1 and 527 in class 2 -722-527= 195 individuals died - 195/722= 0.271 = the proportion of individuals from the population dying - the number qx goes in the line where 722 individuals are as it is the proportion of thos that died
What is in the sixth column of a life table?
-fecundity -bx or mx
How do you get bx or mx?
- it is the number of offspring per individual
What is this equation?

-finite rate of increase
Nt= number of individuals
Nt+1= number of individuals at time +1
-can calculate if have two points on a graph to compare the poulation growth
What is this equation?

- Fundamental net reproductive rate
- maximum rate of increase in that habitat
What is a possible problem with cohorts?
-living for a long time, longer than funding, or scope
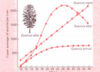
What are survivorship curves for?
- show how the proportion of the original group surviving changes over time
- hence (if using a log scale) how survival probability changes over time
- if a straight line= rate of decline is constant over time
Explain:

- three types of survivorship curves
- Type I= humans, stable then steep decline
- Type II= birds, constant decline
- Type III= oaks, many die young and not many die later
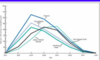
What does a fecundity schedule look like for animals?
- low at first, reaches high and then decreases with age
- same for most species (animals)
- the peak can move (humans= postponing having children)
How can fecundity change in fisheries?
- we catch the big ones often before reproduction
- they adapt, start reproducing at smaller size
What does a fecundity schedule look like in plants?
- not as typically shaped curves
- varies