Epi - Comp Exam Flashcards
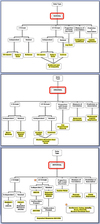
What is Descriptive Epidemiology?
Distribution of Disease
Who/When/Where
- Frequencies of disease occurrences.
- Counts and their relation to size of population.
- Patterns of disease occurances:
- Encompasses person place and time.
What is Analytic Epidemiology?
Determinants of Disease
Associations vs. Causes (Causation)
Why/How
- Factors of susceptibility/exposure/risk
- Etiology/causes of disease
- Mode(s) of transmission
- Social/environmental/biologic elements that determine the ocurrence/presence of disease.
What are the 6 core functions of epidemiology?
- Public health surveillance
- Field investigation
- Analytic studies
- Evaluation
- Linkages
- Policy development
What is an epidemic?
Occurance of disease clearly in excess of normal expectancy with community/period clearly defined.
What is an outbreak?
An epidemic limited to a localized increase in the occurance of disease. Sometimes interchanged with ‘cluster.’
What is an endemic?
The constant presence of a disease within a given area or population in excess of normal levels in other areas.
What is an emergency of international concern?
An epidemic that alerts the world to the need for high vigilance (pre-pandemic labeling).
What is a pandemic?
An epidemic spread world-wide (global health impact), could be multi-national or multi-continent.
What is Incidence Density?
Incidence Rate when summed over multiple time periods.
What is Point Prevalence?
Prevalence at a given point in time.
What is Period Prevalence?
Prevalence over a given period of time.
What is a Crude Morbidity Rate?
of Persons with Disease / # of Persons in Population
What is a Crude Mortality Rate?
of Deaths (all causes) / # of Persons in Population
What is a Cause-Specific Morbidity Rate?
of Persons with cause-specific disease / # of Persons in Population
What is a Cause-Specific Mortality Rate?
of Cause-Specific Deaths / # of Persons in Population
What is a Case-Fatality Rate?
of Cause-Specific Deaths / # of Cases of Disease
What is a Cause-Specific Survival Rate?
of Cause-Specific Cases Alive / # of Cases of Disease
What is a Proportional Mortality Rate (PMR)?
of Cause-Specific Deaths / total # of Deaths in Population
What is a Live Birth-Rate?
of Live Births / 1000 Population
What is a Fertility Rate
of Live Births / 1000 women of childbearing age (15-44)
What is a Neonatal Mortality Rate?
of deaths in those <28 days of age / 1000 live births
What is a Postnatal Mortality Rate?
of deaths in those between 28 days and 1 year of age / 1000 live births
What is an Infant Mortality Rate?
of deaths in those < 1 year of age / 1000 live births
What is a Maternal Mortality Ratio?
of female deaths related to pregnancy / 100,000 live births
What is Infectivity?
Infectivity is the ability to invade a patient (host) .
infected / # susceptable (at risk)
What is Pathogenicity?
Pathogenicity is the ability to cause clinical disease.
with disease / # infected
What is Virulence?
Virulence is the ability to cause death.
of deaths / # with infectious disease
What is Risk?
Risk
- A proportion that calculates the probability of outcome.
- Example:
- Risk of Outcome in the ‘Exposed’ is:
- “exposed with disease” / “all exposed”
- Risk of Outcome in the “Non-exposed” is:
- “non-exposed with disease” / “all non-exposed”
- Risk of Outcome in the ‘Exposed’ is:
What is Absolute Risk Reduction (ARR)?
Absolute Risk Reduction (ARR), aka Attributable Risk, is the risk difference of the outcome attributable to exposure difference between groups.
Example:
If Risk is 40.9% in the treatment group and 53.6% in non-treatment group then:
ARR = |40.9% - 53.6%| = 12.7%
What is Relative Risk Reduction?
The Relative Risk Reduction is the ARR compared with the Risk of the exposed.
Example:
If Risk is 40.9% in the treatment group and 53.6% in non-treatment group then:
ARR = |40.9% - 53.6%| = 12.7%
RRR = 12.7% / 53.6% = 23.7%
What is the Number Needed to Treat (NNT) / Number Needed to Harm (NNH)?
The NNT is the number of patients needed to be treated to receive the stated benefit/harm. NNT = 1 / ARR (in decimal format) with answer always being rounded to nearest whole number.
Example:
If you have a certain medication that has shown an absolute risk reduction of 12.7% then:
NNT = 1 / 0.127 = 8 patients.
How are Ratios interpreted?
All ratios (RR, OR, HR) compare 2 groups and describe the liklihood of event/outcome in 1 group compared to another.
Ratio values:
- If Ratio is 1.0 then the event/outcome is equally likely for both groups.
- If Ratio is >1.0 then the event/outcome is more likely to occur in comparison group.
- If Ratio is <1.0 then the event/outcome is less likely to occur in comparison group.
How are Ratios reported?
- =1.0 - no difference
- >1.0 - Increased Ratio (RR/OR/HR)
- 1.01 - 1.99 = use decimal value (converted to %)
- RR = 1.53, then comparator group is at a 53% increased risk.
- >1.99 = use phrase “x” times greater for interpretation
- OR = 6.18, then comparator group has 6.18 times greater odds
- 1.01 - 1.99 = use decimal value (converted to %)
- <1.0 - Decreased Ratio (RR/OR/HR)
- 0.0001 - 0.99 = subtract from 1.0, then convert to %
- HR = 0.73, then comparator group has a 27% decreased probability of the hazard outcome.
- 0.0001 - 0.99 = subtract from 1.0, then convert to %
How are Confidence Intervals for Ratios interpreted?
If both values of the CI for a Ratio is on the same side of 1.0, it is always statistically significant.
How is the Odds Ratio interpretted?
Odds Ratio is interpretted just like any ratio.
Example: OR = 10.09
_____ exposed are 10 x more likely to _____ than _____ not exposed.
What are the 3 required elements in interpretting Odds Ratios?
3 Required Elements:
- The comparison group
- Percentage/times more/less likely
- Compared to reference group.
If there is a lack of apparent exchangeability/comparability, what type of bias can that cause?
Confounding
Before declaring a real or true association, what 3 aspects do epidemiologists evaluate and what kind of validity are they evaluating?
Internal Validity
- 3 aspects of internal validity:
- Confounding or Effect Modificaiton
- Bias
- Statistical significance.
How do you test for confounding?
Testing for Confounding
- Calculate CRUDE (unadjusted) measure of association (OR/RR) between exposure and outcome.
- Calculate outcome measure of association (OR/RR) between exposure and outcome for each individual strata (levels, groupings, or categories) of the potential confounder.
- Create a weighted-average of all strata (if near-equal), commonly called adjusted association.
- Authors must indicate what variables are utilized in ‘adjusting’ the measure of association.
- Create a weighted-average of all strata (if near-equal), commonly called adjusted association.
- Compare the Crude vs. Adjusted measures of association between exposure and outcome.
- If they vary by 15% or more, then confounding is present.
What are the two main impacts of confounding?
Impact of Confounding
- Magnitude (strength) of association
- If association is more extreme (ratio goes up), less extreme (ratio goes down) compared to unadjusted association.
- Direction of association
- Can produce an association in an opposite direction, towards or away from a null (equal) association.
What are ways of controlling confounding?
Controlling Confounding
- Study design phase:
- Randomization
- Restriction
- Matching
- Analysis of data stage:
- Stratification (w/ weighting)
- Multivariate statistical analysis (regression analyses)
How does randomization help control for confounding and what are its strengths and weaknesses?
Controlling for Confounding - Randomization
- Randomization hopefully allocates an equal number of subjects with the known (and unassessed) confounders into each intervention group.
- Strength:
- With sufficent sample size (N), randomization will likely be successful in making groups equal.
- Stratified version more precisely assures equal-ness.
- Weakness:
- Sample size (N) may not be large enough to control for all unknown or unassessed confounders.
- Process doesn’t guarantee successful, equal allocation between all intervention groups for all known and unknown confounders.
- Practical only for Interventional studies.
How does restriction help control confounding and what is its strengths and weaknesses?
Controlling for Confounding - Restriction
- Study participation is restricted to only subjects who do not fall within pre-specified category(ies) of the confounder.
- Strength:
- Straight forward, convenient and inexpensive.
- Does not negatively impact internal validity.
- Weakness:
- Sufficiently narrow restriction criteria may negatively impact ability to enroll subjects (reduced sample size (N))
- If restriction criteria is not sufficiently narrow it will allow the introduction of residential (other) confounding effects.
- Eliminates researchers ability to evaluate varying levels of the factor being excluded.
- Can negatively impact external validity (generalizability).
How does matching help control for confounding and what is its strengths and weaknesses?
Controlling for Confounding - Matching
- Study subjects selected in matched-pairs related to the confounding variable, to equally distribute confounder among each study group.
- Strength:
- Intuitive, some feel it gives greater analytic efficiency.
- Weakness:
- Difficult to accomplish, can be time consuming, and potentially expensive.
- Doesn’t control for any confounders other than those matched.
- Over-matching possible; this will mask (blunt) findings.
How does stratification help control for confounding and what are its strengths and weaknesses?
Controlling for Confounding - Stratification
- Descriptive and statistical analysis of data evaluating association between exposure and outcome within the various strata (categories/levels) within the confounding variable(s).
- Strength:
- Intuitive (to some), straight-forward and enhances understanding of data.
- Weakness:
- Impractical for simultaneous control of multiple confounders, especially those with multiple strata (categories) within each variable being controlled.
How does multi-variate analysis help control for confounding and what are its strengths and weaknesses?
Controlling for Confounding - Multi-Variate Analysis
- Statistical analysis of data by mathematically factoring out the effects of the confounding variable(s).
- Strength:
- Can simultaneously control for multiple confounding variables.
- In statistical regressions, ORs can be obtained and interpreted.
- Weakness:
- Process requires individuals (researchers/readers) to clearly understand (interpret) the data (results).
- Can be time consuming for researcher/biostatistician.
- Examples:
- Regressions (linear and logistic versions)
- Cox Proportional Hazards
What is effect modification?
Effect Modification
- A 3rd variable, that when present, modifies the magnitude of effect of a true association by varying it within different strata of the 3rd variable.
- If an interaction is present, the researcher must report the measures of association for each strata individually.
- Unlike confounding, an effect modifying variable should be described and reported at each level of the variable, rather than controlled, or adjusted, for.
How do you test for effect modification?
Testing for Effect Modification
- Calculate crude measure of association between exposure and outcome (OR/RR)
- Calculate strata-specific measures of association between exposure and outcome (OR/RR) for each strata of 3rd variable.
- Compare each of the strata-specific measures of associations between each other [while referencing the adjusted measure of association].
- The measure of association between the lowest and highest strata of the effect-modifying variable will be 15% or more different if effect modification is present.
What 3 aspects of a study must a researcher evaluate before declaring a real, true association?
- Confounding or effect modification
- Bias
- Statistical significance
What is bias?
Bias - Systematic (non-randon) error in study design or conduct leading to erroneous results.
What does bias distort?
Bias distorts the relationship (association) between exposure and outcome.
What can be done to “fix” bias once it has already occured?
Nothing
What can minimize bias and its impact?
Prospective (pre-study) consideration and adjustment can minimize bias and its impact.
What 3 elements can bias impact?
Bias can impact:
- Source/type
- Magnitude/strength
- Direction
Considering bias impact on “Source/Type,” what are the 2 main categories of bias.
2 Main Categories of Bias
- Selection-related
- Measurement-related
What is selection-related bias?
Selection-Related Bias
- Any aspect in the way the researcher selects or acquires study subjects which creates a systematic difference between groups.
- Commonly seen when comparative groups not coming from the same population/group or not being representative of the full population or even differentially-selected (processes)
DON’T DO ANYTHING THAT IS DIFFERENT, OR CREATES A DIFFERENCE, BETWEEN GROUPS!!!
SAME-SAME-SAME
What is measurement-related bias?
Measurement-Related Bias
- Any aspect in the way the researcher collects information, or measures/observes subjects which creates a systematic difference between groups.
- Errors in measurement can also cause a resultant error in patient classification (misclassification)
DON’T DO ANYTHING THAT IS DIFFERENT, OR CREATES A DIFFERENCE, BETWEEN GROUPS!!!
SAME-SAME-SAME
What are the 2 types of selection bias?
Selection Bias
- Healthy-Worker Bias
- Self-Selection/Participant (Responder) Bias
Under measurement bias, what are the 5 subject-related types of bias?
Measurement Bias - Subject-Related
- Recall bias
- Hawthorne Effect
- Contamination bias
- Compliance/Adherence bias
- Lost to follow-up bias
What is recall bias?
Recall Bias
- A differential level of accuracy/detail in provided information between study groups.
- Exposed or diseased subjects may have a greater sensitivity for recalling their history (better memory; easier to remember if more severe) or amplify (exaggerate) their responses.
What is the Hawthorne Effect?
Hawthorne Effect
- Individuals alter/modify their behavior because they are part of a study and know they are under observation.
What is misclassification bias?
Misclassification Bias - error in classifying the disease, exposure status, or both.
What are the two types of misclassification bias?
Misclassification - 2 Types
- Non-differential
- Differential
What is non-differential misclassification bias?
Non-Differential Misclassification
- Error is distributed equally in both groups.
- Misclassification of exposure or disease that is unrelated to the other (disease or exposure), depending on study design.
- Effect: For dichotomous (2 cat.) variables, bias can move the measure of association (RR/OR) towards 1.0; it attenuates your effect estimates of association.
What is differential misclassification bias?
Differential Misclassification
- Error in one group is different than other.
- Misclassification of exposure or disease is RELATED to the other (disease or exposure), depending on study design.
- Effect: Bias can move the measure of association (RR/OR) in either direction in relation to 1.0; it can inflate (away from 1.0) or attenuate (towards 1.0) your effect estimates of association.
What methods can be used to control for bias?
Controlling for Bias
- Select the most precise, acurate, & medically-appropriate measures of assessment and evaluation/observation.
- Blinding/masking
- Use multiple sources to gather all information
- Randomly allocate observers/interviewers for data collection (and train them!; use technology!)
- Build as many methods necessary to minimize loss to follow-up.
- Lost-to-followup bias (differential attrition bias)
What are the 3 types of associations (relationships).
Associations (Relationships) - Types
- Artifactual (false) associations.
- Non-causal associations.
- Causal associations.
What can cause artifactual associations?
Artifactual Associations
- Can arise from Bias and/or Confounding.
How can non-causal associations occur?
Non-Causal Associations
- Can occur in 2 different ways:
- The disease may cause the exposure (rather than the exposure causing the disease)
- The disease and the exposure are both associated with a third factor (confounding).
What are the 3 types of causal relationships?
Causal Relationships - 3 Types
- Sufficient Cause
- Necessary Cause
- Component Cause
What are Hill’s Guidelines?
Hill’s Guidelines
- Inductively-oriented criteria for epi causal inference process.
- Hill disagreed that “hard-fast” rules of evidence could be generated by which to judge likelihood of causation.
- Criteria:
- Strength
- Consistency
- Temporality
- Biologic Gradient
- Plausibility
- The higher the number of criteria met, when evaluating an ‘association,’ the more likely it may be causal.
In Hill’s guidelines, what does strength refer to?
Strength
- Strength refers to the size of the measure of association (RR/OR/HR)
- The greater the association the more convincing it is that the association might actually be causal.
- “A strong association is neither necessary nor sufficient for causality and weakness of an association is neither necessary nor sufficient for absence of casuality.”
In Hill’s guidelines, what does consistency refer to?
Consistency
- The repeated observations of an association in different populations under different circumstances in different studies (not just once).
- Consistency may still obscure the truth.
In Hill’s guidelines, what does temporality refer to?
Temporality
- Reflects that the cause precede the effect/outcome in time.
- Time-order also describable:
- Proximate cause (short-term interval)
- Distant cause (long-term interval)
In Hill’s guidelines, what does biologic gradient refer to?
Biologic Gradient
- Presence of a gradient of risk (dose-response) associated with the degree of exposure.
In Hill’s guidelines, what does plausibility refer to?
Plausibility
- Presence of a biological feasibility to the association, which can be understood and explained (biologically, physiologically/medically)
- Is the event/exposure biologically-plausible, if really true?
- At issue: Plausibility decision on criterion-based from existing/known beliefs, which may be flawed or incomplete.
Determining incubation periods.

What is incidence and how is it calculated?
Incidence (a.k.a. Risk or Attack Rate) is new cases of disease divided by the “at risk” or base population. (Proportion)
Useful for non-dynamic populations.

What is prevalence and how is it calculated?
Existing cases of disease + new cases of disease divided by the “at risk” or base population. (Proportion)
- Time frames for numerator/denominator must be the same.
- The denominator includes those already with the disease and those at risk of getting the disease.
- May also be represented as:
- Point Prevalence
- Period Prevalence

What is Incidence Rate and how is it calculated?
Incidence Rate is the proportion of new cases over the person-time at risk for the disease (or in pop).

What is Risk Ratio (a.k.a. Relative Risk)?
Risk Ratio or Relative Risk is the ratio of the Risks from 2 different groups.

What is an Odds Ratio?
Odds Ratio - Ratio of the odds from 2 different groups.
Example:
Odds of Exposure in Diseased / Odds of Exposure in Non-Diseased
or
(A/C) / (B/D)
*Can cross multiply in 2x2 table to get odds ratio. (AD/BC)

What is confounding?
Confounding
- A 3rd variable (characteristic related to study subjects) that distorts an association (RR/OR/HR) between the exposure and outcome.
- An alternative explanation of the association

To be a confounder, what three requirements must be met?
3 Requirements of Confounders
- Independently associated with the exposure.
- Independently associated with the outcome.
- Not directly in the causal-pathway linking exposure to outcome.

What does a quantitative study design use to represent data?
Numbers
What does a qualitative study design use to represent data?
Words
What are the 2 types of quantitative studies?
Quantitative Study Designs
- Interventional
- Observational
What are interventional studies?
Interventional Study Designs
- Considered “experimental”
- Investigator selects interventions (exposure).
- Researcher-forced group allocation.
- Commonly done by randomization.
- Can demostrate causation.
- AKA: clinical trial, clinical study, experimental study, human study, investigational study.
What are observational studies?
Observational Study Designs
- Considered “natural”
- Researchers “observe” subject-elements occuring naturally or selected by individual.
- Useful for unethical study designs using forced interventions.
- Most observational study designs not able to prove causation.
- No researcher-forced group allocation.
In interventional studies, what are the general differentiators between the phases?
Interventional Studies - General Phase Differentiators
- Purpose/focus
- Population studied (healthy/diseased).
- Sample Size
- Duration
What is study design selection based on?
Study Design - Selection
Based on:
- Perspective of hypothesis.
- Ability/desire of researcher to force group allocation (randomization).
- Ethics of methodology.
- Efficiency & practicality.
- Costs
- Validity of acquired information (Internal Validity).
- Applicability of acquired information to non-study patients (External Validity - Generalizability).
What is study population selection based on?
Study Population - Selection
- Research hypothesis.
- Population of interest.
- Criteria:
- Desired vs. logical vs. plausible selection criteria:
- Inclusion & exclusion.
- Case & control group.
- Exposed & non-exposed group.
- Desired vs. logical vs. plausible selection criteria:
- Ethics - Principles of bioethics must be met.
- Equipoise - genuine confidence that an intervention may be worthwhile (risk vs. benefit) in order to use it in humans.
What is the null hypothesis?
Research Hypothesis - Null Hypothesis
- H0
- A research perspective that states there will be NO (true) difference between the groups compared.
- Most conservative and commonly utilized.
- Researchers either reject or don’t reject this perspective.
What are the 3 statistical-perspectives that can be taken by a researcher?
Research Hypothesis - Statistical-Perspectives
- Superiority
- Noninferiority
- Equivalence
What is an alternative hypothesis?
Research Hypothesis - Alternative Hypothesis
- H1
- A research perspective which states there will be a (true) difference between the groups compared.
What are the 2 types of error in inaccurately accepting or rejecting the null hypothesis?
Research Hypothesis - Error
- Type I - False positive.
- Type II - False negative.

What are examples of probability sampling schemes?
Sampling Schemes - Probability
- Simple Random
- Systemic Random
- Stratified Simple
- Stratified Disproportionate
- Multi-Stage Random
- Cluster Multi-Stage
Describe simple random sampling.
Sampling Schemes - Simple Random
- Assign random numbers, then take randomly-selected numbers to get desired sample size, OR
- Assign random numbers, then sequentially-list numbers and take desired sample size from top (or bottom) of listed numbers.
Describe systematic random sampling.
Sampling Schemes - Systematic Random
- Assign random numbers, then randomly sort these random numbers, then select highest (or lowest) number, then systematically, by a pre-determined sampling-interval take every nth numbers to get desired sample size.
Describe stratified simple random sampling.
Sampling Schemes - Stratified Simple
- Stratify sampling frame by desired characteristics (e.g., gender), then use simple random sampling to select desired sample size.
- Example:
- Population has 40 females and 60 males, random sampling may not give a sample that is 40% F/60% M.
- Could separate population into strata of females and males, and for each round of sampling select 4 females and 6 males. This gives 4:6 ratio.
- Keeps sample proportionate to population.
Describe multi-stage random sampling.
Sampling Schemes - Multi-Stage Random
- Uses simple random sampling at multiple-stages towards patient selection.
- Regions/counties (primary sampling unit; PSU).
- City blocks/zip codes (secondary sampling unit; SSU).
- Clinic/hospital/household
- Individual/occurrence

Describe cluster multi-stage random sampling.
Sampling Schemes - Cluster Multi-Stage
- Same as multi-stage random sampling but ALL ‘elements’ clustered together (at any stage) are selected for inclusion.
- ALL clinics in zip code.
- ALL housholds in community.

Describe stratified disproportionate random sampling.
Sampling Schemes - Stratified Disproportionate
- Disproportionately utilizes stratified simple random sampling when baseline population is not at the desired proportional percentages to the referent population.
- Stratified sample ‘weighted’ to return sample population back to baseline population.
- Useful for ‘over-sampling’
What are non-probability sampling schemes?
Sampling Schemes - Non-Probability
- Quasi-systematic or convenience samples (not really, completely, random or fully probabilistic).
- Decide on what fraction of population is to be sampled and how:
- Examples:
- All persons whose last name begins with “M-Z.”
- All members of a professional business association.
- All persons attending clinic every M/W/F for 6 months.
- All persons referred by selected-peers.
- CONCERN: There is some known or unknown order to the sample generated by the selected scheme which may introduce bias (selection bias).
What are the 4 key principles of bioethics?
4 Key Principles of Bioethics
- Autonomy
- Beneficence
- Justice
- Nonmaleficence
Describe the bioethical principle of autonomy.
Principles of Bioethics - Autonomy
- Self-rule / self-determination.
- Participants decide for themselves without outside influences (i.e., coercion, reprisal financial manipulation.
- Have full and complete understanding of risks and benefits.
- No misinformation, incomplete information, or ineffectively-conveyed information (language or ed level).
Describe the bioethical principle of beneficence.
Principles of Bioethics - Beneficence
- To benefit, or do good for, the patient (not society).
Describe the bioethical principle of justice.
Principles of Bioethics - Justice
- Equal & fair treatment regardless of patient characteristics.
Describe the bioethical principle of nonmaleficence.
Principles of Bioethics - Nonmaleficence
- Do no harm.
- Researchers must not:
- Withhold info.
- Provide false info.
- Exhibit professional incompetence.
What are the levels of IRB review?
IRB - Levels and Differences
- Full Board - used for all interventional trials with more than minimal risk to patients.
- Expedited - minimal risk and/or no patient identifiers.
- Exempt - no patient identifiers, low/no risk, de-identified dataset analysis, environmental studies, use of existing data/specimens (de-identified).
Who decides the level of IRB review, and what are the main differences between the levels?
IRB - Determining Level
- Higher level requires more members, time, and level of detail, for committee review/approval.
- Level determined by
What is the Data Safety & Monitoring Board (DSMB)?
Data Safety & Monitoring Board
- Semi-independent committee not involved with the conduct of study but charged with reviewing study data as study progresses.
- Done to assess for undue risk/benefit between groups.
- Pre-determined review periods.
- Can stop study early, for either overly-positive or overly-negative findings in one or more groups (compared to others).
Describe Phase 0 in interventional studies.
Interventional Studies - Phase 0
Exploratory; Investigational New Drug
- Exploratory; Investigational New Drug
- Assess drug-target actions and possibly pharmacokinetics in single or ‘a few’ doses (first in human use).
- Healthy (or diseased patients (oncology)) volunteers.
- Very small N (e.g., <20).
- Very short duration (e.g., single dose to just a few days).
Describe Phase 1 of interventional studies.
Interventional Studies - Phase 1
Investigational New Drug
- Assess safety/tolerance and pharmacokinetics of one or more dosages (first-in-human / early-in-human use).
- Healthy or disease volunteers (depends on disease).
- Small N (e.g., 20-80).
- Short duration (e.g., just a few weeks)
Describe Phase 2 of interventional studies.
Interventional Studies - Phase 2
Investigational New Drug
- Assess effectiveness (continue to assess safety/tolerability; expands on Phase 1 purpose)
- Diseased volunteers (may have narrow inclusion criteria for isolation of effects).
- Larger N (e.g., 100-300)
- Shorter-to-Medium duration (e.g., a few weeks to a few months).
Describe Phase 3 of interventional studies.
Interventional Studies - Phase 3
Investigational New Drug; Indication/Population
- Assess effectiveness (continues to assess safety/tolerability)
- Diseased volunteers:
- May expand inclusion criteria and comparison group(s) for delineation of effects
- Various statistical-perspectives can be taken in studies:
- Superiority
- Noninferiority
- Equivalency
- Larger N (e.g., 500-3000)
- Longer duration (e.g., a few months to a year+).
Describe Phase 4 of interventional studies.
Interventional Studies - Phase 4
Post FDA-Approval
- Assess long-term safety, effectiveness, optimal use (risk/benefits)
- Diseased volunteers
- Expand use criteria (comorbidities/concomitant meds.) for delineation of long-term safety/effects.
- Population N (e.g., a few-hundred to a few-hundred-thousand)
- Wide-range of durations (e.g., a few weeks to several years; ongoing)
- Interventional or observational designs.
- Registries/surveys also used in observational studies.
What are the advantages and disadvantages of interventional trials?
Interventional Trials - Advantages & Disadvantages
- Advantages:
- Can demonstrate causation (cause precedes effect).
- Only designs used by the FDA for “approval” process.
- Disadvantages:
- Cost
- Complexity/time (development, approval, conduct)
- Ethical considerations (risk v. benefit eval)
- Generalizability (external validity)
What are some examples of paitent-oriented endpoints (POEM’s)?
Patient-Oriented Endpoints
- Death
- Stroke or MI
- Hospitalization
- Preventing need for dialysis
What are some examples of disease-oriented endpoints (DOE’s)?
Disease-Oriented Endpoints (DOE’s)
- DOE’s; surrogate markers (elements used in place of evaluation patient-oriented (direct) endpoints)
- Blood pressure (for risk of stroke)
- Cholesterol (for risk of heart attack)
- Change in SCr (for worsening renal function)
What is group allocation and the 2 types of group allocation?
Interventional Study Design - Group Allocation
- Group allocation is similar to sample selection, however, it is the allocation of that sample into groups.
- Types:
- Non-random
- Random
Describe non-random group allocation.
Group Allocation - Non-Random
- Subjects don’t have an equal probability of being selected or assigned to each intervention group (e.g., convenience sampling/non-probabilistic allocation.
- Patients attending morning clinic assigned to group 1, patients attending afternoon clinic assigned to group 2.
- Patients attending clinic on even days assigned to group 1, patients attending clinic on even days assigned to group 2.
- The first 100 patients admitted to hospital.
Describe random group allocation and its purpose.
Group Allocation - Random
- Subject do have an equal probability of being assigned to each intervention group.
- Random-number generating programs.
- Purpose: to make groups as equal as possible; based on known and unknown important factors (confounders).
- Attempts to reduce systematic differences (bias) between groups which could impact results/outcomes.
- Equality of groups not guaranteed.
- Documentation of equality of groups (effectiveness of randomization process) reported in 1-of-several locales:
- p values shown in table format.
- p values not shown but text statement given in key of table.
- p values not shown but text-statement given in article.
What are the forms of randomization?
Interventional Study Designs - Forms of Randomization
- Simple - equal probability for allocation within one of the study groups.
- Blocked - ensures balance within each intervention group.
- When researchers want to assure that all groups are equal in size.
- Stratified - ensures balance with known confounding variable.
- Examples: gender, age, disease severity/duration, comorbidities.
- Can also pre-select levels to be balanced within each interfering factor (confounder).
What are case-control studies?
Case-Control Studies
- Observational studies.
- Allows researcher to be a passive observer of natural events occuring in individuals with the disease/condition of interest (cases) who are compared with people who do not have the condition of interest (controls).
- Controls supply info about expected baseline risk profile in population from which cases are drawn.
- Group assigned by disease status.
- Useful when studying a rare disease or investigating an outbreak.
- Commonly generates:
- Odds of exposure.
- Odds ratio (OR).
What are the reasons a case-control study design may be selected?
Case-Control Study Design - Reasons for Selection
- Unable to force group allocation (unethical, not feasible).
- Limited resources (time, money, subjects).
- Disease of interest is rare in occurence and little is known about its associations/causes.
- Directly assesses the perspective of the hypothesis.
- Prospective exposure data is difficult/expensive to obtain and/or very time inappropriate.
- Customarily conducted in a retrospective fashion.
What are the strengths of a case-control study?
Case-Control Studies - Strengths
- Good for assessing multiple exposures of one outcome.
- Useful when diseases are rare.
- Useful when determining associations (not causation).
- Less expensive and time consuming than interventional trials and prospective cohort studies.
- Useful when ethical issues limit interventional studies.
- Useful when disease has a long induction/latent period.
What are the weaknesses of case-control studies?
Case-Control Studies - Weaknesses
- Can’t demonstrate causation.
- Can be impacted by unassessed confounders.
- Retrospective; can’t control for other exposures or potential changes in amount of study-exposure during study frame.
- Can be impacted by various biases, most importantly selection & recall/assessment biases.
- Limited by available data (retrospective nature of design).
Where can the control group come from?
Case-Control Studies - Control Groups
- Population (state/community/neighborhood).
- Can be obtained via numerous avenues, even randomly.
- Institutional/Organizational/Provider
- Illness(es) of controls should be unrelated to exposure(s) being studied.
- Spouse/Relatives/Friends
- Genetic, environmental, socio-economic, etc… similarities.

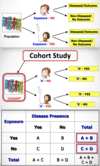
What is a cohort study?
Cohort Study Design
- Observational studies allowing researcher to be a passive observer of natural events occuring in naturally-exposed and unexposed (comparison) groups.
-
Group-allocation based on:
- Exposure-status OR
- Group membership (something in common).
- Useful when studying a rare exposure
- Also called incidence studies/longitudinal studies.

How are cases selected for case-control studies?
Case-Control Studies - Case Selection
- Defined by the investigator (hopefully) using accurate, medically-reliable, efficient data sources.
- Applied to all study participants:
- Objectively, consistently, accurately, and with validity.
- Clinically-supportable/definable criteria are best.
- From published, professionally-recognized and accepted diagnostic criteria and/or from multiple sources of data.
- Applied to all study participants:
-
Classifying patients correctly is ideal, but present is the risk of ‘misclassifying’ subjects (into wrong group)
-
Misclassification:
- Differential
- Non-differential
-
Misclassification:
What is non-differential misclassification bias?
Non-Differential Misclassification
- Error is distributed equally in both groups.
- Misclassification of exposure or disease that is unrelated to the other (disease or exposure), depending on study design.
- Effect: For dichotomous (2 cat.) variables, bias can move the measure of association (RR/OR) towards 1.0; it attenuates your effect estimates of association.
What is differential misclassification bias?
Differential Misclassification
- Error in one group is different than other.
- Misclassification of exposure or disease is RELATED to the other (disease or exposure), depending on study design.
- Effect: Bias can move the measure of association (RR/OR) in either direction in relation to 1.0; it can inflate (away from 1.0) or attenuate (towards 1.0) your effect estimates of association.
Why would the cohort study design be selected?
Cohort Study Design - Reason for Selection
- Unable to force group allocation (‘randomize’).
- Unethical / Not feasible
- Limited resources.
- Exposure of interest is rare in occurence and little is known about its association/outcomes.
- More interested in incidence rates or risks for outcome of interest than effects of interventions.
What are the strengths of cohort studies?
Cohort Studies - Strengths
- Good for assessing multiple outcomes of 1 exposure (hard to control for other exposures if more than one potentially associated with outcome).
- Useful when exposures are rare.
- Useful in calculating risk and RR.
- Less expensive than interventional trials.
- Good when ethincal issues limit use of interventional study.
- Good for long induction/latent periods (retrospective).
- Able to represent “temporality” (Prospective).
What does sensitivity mean?
Medical Screening - Sensitivity
- How well a test can detect presence of disease when in fact disease is present.
- Proportion of time that a test returns a true positive.
- Highly sensitive = low rate of false negative.
- Sensitivity =
- TP/(TP+FN) * 100%
- TP/(All Diseased) * 100%

What does specificity mean?
Medical Screening - Specificity
- How well a test can detect absence of disease when in fact the disease is absent.
- Proportion of time a test returns true negatives.
- Specificity =
- TN/(TN+FP) * 100%
- TN/(All Without Disease) * 100%

What are the weaknesses of cohort studies?
Cohort Studies - Weaknesses
- Can’t demonstrate causation (well-controlled prospective more likely to approximate causation).
- Hard to control for other exposures if more than one plausible for being associated with an outcome (primarily retrospective).
- Retrospective - can’t control for other exposures (if not known/assessed) or potential changes in amount of study-exposure during study frame.
- Not good for long induction/latent periods (retrospective much better here).
- Can be impacted by unassessed confounders (more so with retrospective).
- Can be impacted by various biases, most importantly selection & recall / assessment biases (retrospective).
- Limited by available data (retrospective; much less for prospective).
What does positive predictive value mean?
Medical Screening - Positive Predictive Value
- How accurately a positive test predicts the presence of disease.
- Proportion of TPs in patients with positive test.
- PPV =
- TP/(TP+FP) * 100%
- TP/(All Positive Tests) * 100%

What does negative predictive value mean?
Medical Screening - Negative Predictive Value
- How accurately a negative test predicts the absence of disease.
- Proportion of TNs in patients with negative tests.
- NPV =
- TN/(TN+FN) * 100%
- TN/(All Negative Tests) * 100%

What is diagnostic accuracy or diagnostic precision?
Medical Screening - Diagnostic Accuracy (DA)/ Diagnostic Precision (DP)
- Proportion of total screenings that a patient is correctly identified as either having a disease (TP) or not (TN) with corresponding test results.
- DA/DP =
- (TP+TN)/(TP+FP+FN+TN) * 100%
- (TP+TN) / (All Patients) * 100%

What are likelihood ratios (LR)?
Medical Screening - Likelihood Ratio (LR)
- Ratio of the probability of a given test result for those with disease to a given test result of those without disease.
- Can be calculated for positive and negative test results.
- LR+ should be >10 to demonstrate benefit.
- LR- should be <0.1 to demonstrate benefit.
- LR+ = [(A/(A+C))/(B/(B+D))]
- LR- = [(C/(A+C))/(D/(B+D))]

What is a cross-sectional study design?
Cross-Sectional Studies
- Observational studies that capture health/disease and exposure statuses at the same time.
- AKA prevalence study.
- Called cross-sectional because information gathered represents what is occuring at a point in time or time frame across a large population (a snap-shot in time).
- Aquired without regard to exposure or disease/outcomes status.
- Entire pop or a subset is selected for study.
- May be large-scale, national surveys or databases capturing different aspects of the pop.
- Data from different perspectives (e.g., inpatient vs. outpatient).
What 2 questions should a patient ask their physician when a medical screening test is recommended?
Medical Screening - Questions
- How accurate is the screening test?
- When the results are announced, how confident will you be in your prediction of whether or not I have the disease?
What does it mean if a test has multiple cutoff values?
Medical Screening - Multiple Cutoff Values
- Many diagnoses typically have 2 dichotomous outcomes (pos/neg).
- However, with multiple cutoffs there may be an overlap of positive and negative outcomes.

What are the 4 possible outcomes to medical screenings?
Medical Screening - 4 Outcomes
- True positive.
- True negative.
- False positive.
- False negative.
When a patient asks about the accuracy of a screening test, what information are they looking for?
Medical Screening - Accuracy
- Sensitivity
- Specificity
When a patient asks how confident a physician will be in their prediction of disease when the results are anounced, what information are they looking for?
Medical Screening - Confidence
- Positive predictive value.
- Negative predictive value.
What is validity in medical screening?
Medical Screening - Validity
- Ability to accurately discern between those that do and those that do not have the disease (precision).
- Internal validity - extent of accurate results in study.
- External validity - extent of accurate results in pop.
What is reliability in medical screening?
Medical Screening - Reliability
- Ability of test to return same result on repeated uses (reproducibility or consistency).
- NOTE: A _valid_ test is _always reliable_, yet a _reliable_ test is _not always valid_.
How would you interpret a LR+ of 1.0?
The test is just as likely to return a positive result in a person with disease as in a person without disease.
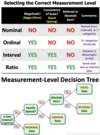
What are the 3 primary levels or groupings of variables (data)?
Variables - Primary Levels
- Levels:
- Nominal
- Ordinal
- Interval or Ratio
- ALL statistical tests are selected based on level of data being compared.
What are the 3 key attributes of data that define their level or grouping, and how are they assessed?
Variables - Key Attributes
- Attributes:
- Order/Magnitude
- Consistency of scale / equal distances
- Rational absolute zero
- Each attribute is assessed with a “Yes” or “No,” ‘does the variable have it?’

What is a nominal variable?
Variables - Nominal
- Dichotomous/binary; non-ranked; non-ordered; Named categories.
- No - order or magnitude.
- No - consistency of scale or equal distances (discrete).
- Nominal variables are simply labeled-variables without quantitative characteristics (or dichotomous/binary).
- ALL DICHOTOMOUS VARIABLES ARE NOMINAL.
- INCLUDES CATEGORICAL VARIABLES DESPITE NUMBER OF CATEGORIES.

What is an ordinal variable?
Variables - Ordinal
-
Ordered, rank-able categories, non-equal distance.
- Yes - order of magnitude.
- No - consistency of scale or equal distances (discrete).
- PAIN SCALE WILL ALWAYS BE ORDINAL ON EXAM.

How do the levels of data vary in specificity/detail?
Variables - Specificity/Detail of Levels
- After data is collected, we can appropriately go down in specificity/detail of data, but never up.

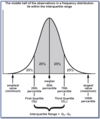
What are measures of central tendency.
Measures of Central Tendency
- Mode / Median / Mean
- Min / Max / Range
- Interquartile Range (IQR)

What is variance?
Measures of Central Tendency - Variance

What is standard deviation?
Measures of Central Tendency - Standard Deviation

What is kurtosis?
Shapes of Data Distribution - Kurtosis
- A measure of the extent to which observations cluster around the mean.
- Kurtosis statistic:
- 0 = normal distribution.
- Positive = more cluster.
- Negative = less cluster.

What percentages coincide with standard deviation ranges?
Standard Deviation - Percentages

What is an interval/ratio variable?
Variables - Interval/Ratio
- Order, magnitude, and equal distances (units).
- Interval = arbitrary zero value (0 doesn’t mean absence)
- Ratio = Absolute (rational) zero value (0 means absence of measurement value), i.e. physiological parameters).
- Yes - order or magnitude.
-
Yes - consistency of scale or equal distances (continuous).
- Living siblings (number) & personal age (in years).
How is interval data, that is not normally-distributed, handled?
Interval Data - Not Normally-Distributed
- Use a statistical test that does not require the data to be normally-distributed (non-parametric tests), or
- Transform data to a standardized value (z-score or log transformation), hoping it will allow the data to be normally distributed.
- ALWAYS RUN DESCRIPTIVE STATISTICS & GRAPHS.

What are parametric tests?
Stats Tests - Parametric
- Stats tests useful for normally-distributed data.
What is skewness?
Shapes of Data Distribution - Skewness
- A measure of the asymmetry of a distribution.
- Perfectly-normal distribution = skewness of 0.
What are the 4 key questions to ask when selecting the correct statistical test?
Statistical Test Selection - Questions for Selection
- What data level is being recorded?
- Does data have order/magnitude?
- Does data have equal, consistent distances along the entire scale?
- What type of comparison/assessment is desired?
- Correlation -> correlation test
- Event-occurrence / time-to-event -> survival test
- Outcome prediction/association (OR) -> regression
- How many groups are being compared?
- Is the data independent or related (paired)?
- Data from the same (paired) or different groups (independent).
- Questions 2-4 get you around the other portions of each individual sheet.

What is a correlation test?
Statistical Tests - Correlation Test
- Correlation (r) - provides a quantitative measure of the strength & direction of a relationship between variables.
- Range from -1.0 - +1.0.
- -1.0 = strong negative correlation.
- 0.0 = no correlation.
- +1.0 = strong positive correlation.
- Partial correlation - correlation that controls for confounding variables.
- Types:
- Nominal correlation test = Contingency Coefficient.
- Ordinal correlation test = Spearman Correlation
- Interval correlation test = Pearson Correlation
- p>0.05 for a Pearson Correlation just means there is no linear correlation; may still be a non-linear correlations present.
- All correlations can be run as a “partial correlation” to control for confounding.

What is a survival test?
Statistical Tests - Survival Test
- “Changes over time.”
- Compares the proportion of events over time, or time-to-events, between groups.
- Commonly represented by a Kaplan-Meier curve (all types can be represented by a Kaplan-Meier curve).
- Types:
- Nominal survival test = Log-Rank test
- Ordinal survival test = Cox-Proportional Hazards test
- Interval survival test = Kaplan-Meier curve

What is a regression?
Statistical Test - Regression
- “Predict likelihood of some outcome” = regression test.
- Provide a measure of the relationship between variables by allowing the prediction about the dependent, or outcome, variable (DV) knowing the value/category of independent variables (IVs)
- Basically, helps to determine how well variables can predict outcome.
- Also able to calculate OR for a measure of association.
- Types:
- Nominal regression test = Logistic Regression
- Ordinal regression test = Multinominal Logistic Regression
- Interval regression test = Linear Regression

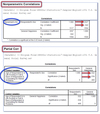
What is a partial correlation, and how is it used to control for confounding?
Partial Correlation
- Correlation that factors in the confounders, trying to keep them “mathematically quiet” to get a better idea of true correlation.
- Can be used to validate correlation test result by controlling for possible confounders.
- Example: Spearman’s returns small, but statistically significant, positive correlation. Partial returns even smaller postive correlation that is statistically not significant. Therefore initial correlation was not true.

What is the Spearman Correlation test?
Correlation - Spearman Correlation Test
- Correlation test for ordinal data.

What is the Contingency Coefficient test?
Correlation - Contingency Coefficient Test
- Correlation test for nominal data.

For proper selection of a parametric test, what are the required assumptions?
Parametric Test - Selection
- Required assumptions:
- Normally-distributed
- Equal variances
- Multiple tests available to assess for equal variances between groups.
- Levene’s test.
- Multiple tests available to assess for equal variances between groups.
- Randomly-derived & independent.
How is sample size determined?
Sample Size
- Minimum difference between groups deemed significant:
- The smaller the difference necessary to be significant = the larger the N needed.
- Expected variation of measurement (known or estimated from past studies/population).
- Type 1 & type 2 error rates & confidence interval (usually 90%-99%)
- ADD IN ANTICIPATED DROP-OUTS OR LOSS TO FOLLOW-UPS.
What is a p value?
p Value
- Statistical tests determine possible error-rate or liklihood of chance in comparing difference or relationship between variables.
- A statistical test critical value is calculated.
- Test statistic value is compared to the appropriate table of probabilities for that test.
- A probability (p) value is obtained; based on the probability of observing, due to chance alone, a test statistic value as extreme or more extreme than actually observed if groups were similar (not different)
- The p-value is selected by investigators before the study starts (a priori).
Describe the statistical significance of the p value.
p Value - Statistical Significance
- If p value is lower than the pre-selected alpha value (customarily 5% (0.05)), then we say it is statistically significant.
- This means that the risk of experiencing a type 1 error is acceptably low if we reject H0.
How is a pre-set p value interpreted?
Pre-Set p Value - Interpretation
- The probability of:
- making a type 1 error if the H0 is rejected.
- erroneously claiming a difference between groups when one does not really exist.
- obtaining group differences as great or greater if the groups were actually the same/equal.
- obtaining a test statistic as high/higher if the groups were actually the same/equal.
What is Levene’s test?
Levene’s Test for Equality of Variances
- Used to assess the equality or homogeneity of variances.
- Independent t-tests assume homogeneity of variances.
- Interpretation:
- >0.05 means variances are NOT significantly different, thus the variances are similar.
- 0.05 or less means variances are significantly different and thus there is no equality or homogeneity of variances.
What is a confidence interval?
Confidence Interval (CI)
- Most common selections are 90%, 95%, or 99%.
- Interpretation:
- We are 95% confident that the “true” difference or relationship between the groups is contained within the confidence interval range.
- Without p value:
- If CI crosses 1.0 (for ratios) or 0.0 (for absolute differences) = NOT significant.
- Calculated at an a priori percentage of confidence, including a high and low value, that statistically includes the real (yet unknown) difference or relationship being compared.
- Based on V/SD and N.
- Journals are moving away from solely reporting p values; or even showing them at all.
What is the Kappa test?
Kappa Tests
- Kappa statistic - a correlation test showing relationship or agreement between evaluators (consistency of “decisions”, “determinations”).
- Kappa interpretation:
- Kappa (K) value can be + or -; + = good agreement; - = poor agreement.
- +1 = the observers perfectly “classify” everyone exactly the same way.
- 0 = There is no relationship at all between the observers’ “classifications,”above the agreement that would be expected by chance.
- -1 = The observers “classify” everyone exactly the opposite of each other.

Fill in:


Fill in:


Fill in:


What statistical tests are used to compare independent, nominal data and what are they comparing?
Independent Nominal Data - Statistical Tests
- 2 groups:
- (Pearson’s) Chi-square test
- 3 groups:
- Chi-square test of independence
- Both tests compares group proportions and if they are different from that expected by chance.
- Assumptions-Both test:
- Usual chi-square (binomial; non-normal) distribution for nominal data.
- No cell count < 5 observations.
- For statistically significant findings (p<0.05) in 3 or more comparisons, one must perform subsequent analysis (post-hoc testing) to determine which groups are different:
- Multiple chi-square tests are NEVER acceptable, risk of Type I error increases with each additional test (almost guaranteed after 4-5).
- Chi-square test of independence
- 2 or more groups with expected cell count of < 5:
- Fisher’s Exact test
- Tests compare frequencies/counts/proportions.
What keywords indicate that data is paired or related?
Paired/Related - Keywords
- “Pre- vs. -post”, “Before vs. After”, Baseline vs. End”, etc.
If given both chi-square and Fisher’s Exact, what is the only situtation in which that can occur?
When the expected cell count is < 5. If you can confirm cell count < 5, then the chi-square is no longer valid and Fisher’s Exact is the right answer.
What statistical tests are used to compare paired/related nominal data and what are they comparing?
Paired/Related Nominal Data - Statistical Tests
- 2 groups of paired/related data:
- McNemar test
- 3 or more groups of paired/related data:
- Cochran
- Same as principle and assumptions as chi-square yet mathematically factors in concept of paired, or related, data.
- Bonferroni test of inequality (Bonferroni correction)
- Adjusts the p value for # of comparisons being made (very conservative).
- Cochran
- Tests compare frequencies/counts/proportions.
- “Pre- vs. -post”, “Before vs. After”, Baseline vs. End”, etc.
What statistical tests are used to compare independent, ordinal data and what do they compare?
Independent Ordinal Data - Statistical Tests
- 2 groups of independent data:
- Mann-Whitney test
- 3 or more groups of independent data:
- Kruskal-Wallis test
- The tests compare the median values between groups.
- Both also used for interval data not meeting parametric requirements.
- If 3+ group comparison significant, must perform a post-hoc test to determine where difference(s) is(are).
What statistical tests are used to compare paired/related, ordinal data and what do they compare?
Paired/Related Ordinal Data - Statistical Tests
- 2 groups of paired/related data:
- Wilcoxon Signed Rank test.
- 3 or more groups of paired/related data.
- Friedman test
- Tests compares the median values between groups.
- Each effective for non-normally distributed interval data or don’t meet all parametric requirements.
- If 3+ group comparison significant, must perform a post-hoc test to determine where differences are.
- “Pre- vs. -post”, “Before vs. After”, Baseline vs. End”, etc.
What are the post-hoc tests used for ordinal data?
Ordinal Data - Post-Hoc Tests
- Student-Newman-Keul test
- All groups MUST be equal in size.
- Compares all pairwise comparisons possible.
- Dunnett test
- Compares all pairwise comparisons against a single control.
- All groups MUST be equal in size.
- Dunn test
- Compares all pairwise comparisons possible.
- Useful when all groups are NOT of equal size.
What statistical tests are used to compare independent, interval data and what do they compare?
Interval Data - Statistical Tests
- Independent Data:
- 2 groups of independent data:
- Student t-test.
- 3 or more groups of independent data:
- Analysis of variance (ANOVA)
- Tests compare the means of all groups (along with intra- and inter-group variations) against a dependent variable.
- If 3+ group comparison significant, must perform a post-hoc test to determine where differences are.
- 2 groups of independent data:
- 3 or more groups of independent data w/ confounders:
- Analysis of Co-Variance (ANCOVA)
- Compares the means of all groups (along with intra- and inter-group variations) against a dependent variable while also controlling for the co-variance of confounders.
- Analysis of Co-Variance (ANCOVA)
What statistical tests are used to compare paired/related, interval data and what do they compare?
Paired/Related Interval Data - Statistical Tests
- 2 groups of paired/related data:
- Paired t-test.
- Compares the mean values between groups that are related.
- Paired t-test.
- 3 or more groups of paired/related data:
- Repeated Measures ANCOVA (1 DV)
- Compares the means of all groups (along with intra- and inter-group variations) of related data against a dependent variable.
- If 3+ group comparison significant, must perform a post-hoc test to determine where differences are.
- Compares the means of all groups (along with intra- and inter-group variations) of related data against a dependent variable.
- Repeated Measures ANCOVA (1 DV)
- 3 or more groups of paired/related data w/ confounders:
- Repeated Measures ANOVA:
- Compares the means of all groups (along with intra- and inter-group variations) against a dependent variable while also controlling for the co-variance of confounders.
- Repeated Measures ANOVA:
What are the post-hoc tests used for interval data?
Interval Data - Post-Hoc Tests
- Student-Newman-Keul test
- All groups MUST be equal in size.
- Compares all pairwise comparisons possible.
- Dunnett test
- Compares all pairwise comparisons against a single control.
- All groups MUST be equal in size.
- Dunn test
- Compares all pairwise comparisons possible.
- Useful when all groups are NOT of equal size.
- Tukey or Scheffe tests
- Compares all pairwise comparisons possible
- All groups must be equal in size.
- Tukey test slightly more conservative than the Stu.N.K.
- Scheffe test less affected by violations in normality and homogeneity of variances - most conservative.
- Bonferroni correction
- Adjusts the p value for # of comparisons being made (very conservative).
What are ways of controlling confounding?
Controlling Confounding
- Study design phase:
- Randomization
- Restriction
- Matching
- Analysis of data stage:
- Stratification (w/ weighting)
- Multivariate statistical analysis (regression analyses)
What is selection-related bias?
Selection-Related Bias
- Any aspect in the way the researcher selects or acquires study subjects which creates a systematic difference between groups.
- Commonly seen when comparative groups not coming from the same population/group or not being representative of the full population or even differentially-selected (processes)
DON’T DO ANYTHING THAT IS DIFFERENT, OR CREATES A DIFFERENCE, BETWEEN GROUPS!!!
SAME-SAME-SAME
What is measurement-related bias?
Measurement-Related Bias
- Any aspect in the way the researcher collects information, or measures/observes subjects which creates a systematic difference between groups.
- Errors in measurement can also cause a resultant error in patient classification (misclassification)
DON’T DO ANYTHING THAT IS DIFFERENT, OR CREATES A DIFFERENCE, BETWEEN GROUPS!!!
SAME-SAME-SAME