Ecology, Plants, and Photosynthesis Flashcards
Action and Absorption Spectrum
Action spectrum: Graph showing rate of photosynthesis for each wavelength of light.
- Green-yellow light shows lowest rate of photosynthesis
- Red-orange light shows good rate of photosynthesis
- Violet-blue light shows best rate of photosynthesis.
Absorption spectrum: Graph showing % light absorbed by pigments within chloroplast (e.g. chlorophyll a + b), for each wavelength of light.
- Green-yellow light shows least absorption/
most reflection. - Red-orange light shows some absorption/
little reflection - Violet-Blue light shows most absorption/
least reflection.
Chlorophyll is most abundant pigment, so rate of photosynthesis greatest at violet-blue light.
However, carotene, another, less common, pigment able to absorb green-yellow light. So even in small amounts, allow some (little) photosynth to occur at wavelengths of light that chlorophyll can’t absorb.

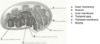
Chloroplast Structure
- Double/inner and outer membrane/envelope – 2 concentric continuous lines close together;
- Grana: Stack of several disc-shaped subunits (thylakoids);
- 70S ribosomes
- Starch granules
- Stroma: Fluid containing enzymes, including rubisco, which are important for LIR’s.
-
Thylakoids:
- Have a large surface area for light absorption.
- Thylakoid space: Small, which causes faster accumulation of H+, which enhances [H+] gradient;
Photosynthesis
LDR’s: (In thylakoid space largely)
- Photosynthesis occurs inside chloroplasts, which contain chlorophyll inside thylakoid membranes, which are arranged in groups called photosystems (I and II).
- Chlorophyll in photosystem II absorbs light; which excites a free e¯ (photoactivation)
- Excited e¯ pass along ETC from carrier to carrier (within thylakoid membrane); from photosystem II to photosystem I (in stroma);
- e¯ flow releases NRG, which is used to pump H+ across thylakoid membs & into thylakoid space; creating [H+] grad in thylakoid space;
- Chemiosmosis couples e¯ transport to ATP synth. (photophosphorylation); meaning that:
- When H+ diffuses back across thylakoid memb (down conc. gradient)(chemiosmosis).
- They pass through ATP synthase; which uses KE from movement of H+ down their conc. grad to synthesise ATP.
(by combining ADP + Pi). - This form of ATP synthesis
= Non-cyclic photophosphorylation.
- Light excites e¯ in photosystem I (photoactivation); to reduce NADP+ to NADPH;
- H2O lyses to form O2 + H+ + e¯ of which:
- O2 is largely released as a waste product
- e¯ used to replace e¯ lost by photosystem II;
- In cyclic photophosphorylation e¯ from photosystem I return to it via ETC between photosystem I and II; which causes H+ to be pumped across thylakoid membrane again.
LIR’s/Calvin Cycle: (In stroma)
- LIRs take place in stroma of chloroplast; to produce carbs; using LDR products.
- Rubisco catalyses; the fixation of CO2 to RuBP; (C-fixation); to form an unstable 6-C compound; which splits into 2 glycerate 3-phosphate molecules;
- LDR’s produce ATP + NADPH; of which:
- ATP provides nrg to reduce glycerate 3-phosphate;
- NADPH provides H for reduction of glycerate 3-phosphate; to triose phosphate;
- Some triose phosphate used to regenerate RuBP;
- Some triose phosphate used to synthesise glucose & (after several cycles) starch;
Factors of Photosynthesis
Limiting Factor: Factor furthest from its optimum & serves to control a process.
- Increasing limiting factor with other factors constant increases rate;
- Increasing non-limiting factor with other factors constant has no effect on rate;
Light intensity: Limiting at low intensity;
- ↑ intensity ↑ photosynthesis up to plateau;
- Low light intensity → ↓ rate of LDR’s → ↓ ATP + NADPH (LDR products) → ↓ LIR’s → ↓ photosynth.
- High light intensity → ↑ rate of LDRs; until chloroplasts become saturated with light (plateau)
Temperature: Limiting at low & high temps;
- ↑ temp ↑ photosynthesis up to certain temp, then ↓ dramatically;
- Low temps limit rate of LIRs reactions;
- High temps (temps > opt. temp of rubisco) → rubisco denatures → CO2 not fixed (dec.);
- ↑ temp ↑ rate of enzyme catalysis in LIR’s (e.g. rubisco) → ↑ rate of photosynthesis.
[CO2]: Limiting in bright light & warm temps; at low [CO2]
- ↑ [CO2] ↑ photosynthesis up to plateau;
- Low [CO2] ↓ rate of C-fixation → ↓ rate of photosynthesis.
- High [CO2] ↑ rate of C-fixation → ↑ rate of photosynthesis until plateau
(when another factor becomes limiting).
Chromatography and Chloroplasts
- Leaf pieces grinded in pestle + mortar, then
propanone added & repeated. - Cover & leave until liquid turns dark green. Then decant or filter liquid.
- Use capillary tube to apply extract to chromatography strip or thin layer strip until small dark spot formed.
- Place chromatography strip into narrow glass tube containing chromatography solvent & leave it until solvent front has moved to top & separated pigments.
- Chlorophyll composed of various pigments:
- Carotene (top layer)
- Xanothophyll
- Chlorophyll a
- Chlorophyll b
Species, Pops, Comms, Ecos
-
Species: Groups of organisms that can interbreed to produce fertile offspring
-
Cross-breeding: When 2 diff species
produce hybrid, reproductively sterile offspring (e.g. liger, mule). Rare.
-
Cross-breeding: When 2 diff species
-
Population: Group of organisms of same species living in same area at same time
- Organisms that live in different regions
are reproductively isolated & unlikely to interbreed, but speciation only occurs if populations can no longer interbreed.
- Organisms that live in different regions
- Communities: Pops of diff species living together & interacting with each other.
- Habitat: Env in which species normally lives.
- Ecosystems: Communities (biotic factors) interacting with abiotic env.
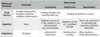
Modes of Nutrition
-
Autotrophs: Obtain inorg. nutrients from abiotic env to synthesise org. compounds
using energy from sunlight (photosynth.) or oxidation of inorg. nutrients (chemosynth.) - These nutrients (e.g. C, N, H, O & P) obtained from air, water & soil.
-
Heterotrophs: Obtain org. nutrients from feeding off other living org. or dead org. matter.
- Consumers: Heterotrophs that feed on living or recently killed org. via ingestion.
- Scavengers: Consumers that feed on dead/decaying carcasses rather than hunt living prey. (e.g. hyenas, vultures, etc.).
-
Detritivores: Heterotrophs that feed on detritius or humus via int. digestion.
- Detritus: Dead org. matter, e.g. decaying org. material & fecal matter
- Humus: Decaying leaf litter intermixed within topsoil.
-
Saprotrophs: Heterotrophs that feed on detritus by secreting dig. enzymes into it, & absorbing the digested products.
- Decomp. release elements like N2 into ecosystem, so that they could be used again by other organisms.
Nutrient Cycling
- Auto obtain inorg. nutrients from air, water & soil; convert them into org comp.
- Hetero ingest org. comp. & use them for growth & respiration, releasing inorg. byproducts
- Saprotrophs decompose the dead org. remains
& free inorg. materials into soil. - Return of inorg. nutrients to soil ensures continual supply of raw materials for autotrophs.
- Cycle begins again.
Ecosystem Sustainability & Mesocosms
3 main components required for ecosystem sustain.
- Energy availability: Light from sun provides the initial energy source for almost all communities
- Nutrient availability: Saprotrophs ensure constant recycling of inorg. nutrients within env
-
Recycling of wastes: Certain bacteria can detoxify harmful waste byproducts.
(e. g. denitrifying bacteria).
Mesocosms: Enclosed env’s that allow small part of natural env to be observed under controlled conditions.
- Terrarium: Small transparent container (e.g. glass or plastic) in which selected plants (or animals) are kept & observed
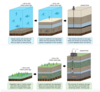
Making a Self-Sustaining Terrarium:
- Terrarium created using glass/plastic bottle with lid.
- 1st layer: pebbles/gravel/sand for drainage purposes.
- 2nd layer: Thin layer of activated charcoal to prevent mold & help aerate soil.
- 3rd layer: Thin moss cover to create barrier between lower layers & soil.
-
4th layer: Pre-moistened growing medium
(i.e. potting mix). - Choose plants that ideally grow slowly
& thrive in some humidity & inspect plant for diseases/insects before placing in terrarium.
(e.g. most ferns, club moss, etc.) - Ensure terrarium placed in location that provides continuous source of light AND
doesn’t experience fluctuating temp. conditions (i.e. avoid direct sunlight) - Don’t initially over-water plants – once right humidity established, terrarium can go months without watering
- Occasional pruning may be required, but nutrients in soil dec, so plant growth should slow down.
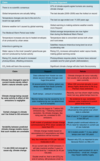
Testing for association between 2 species using Chi-squared test with data obtained from quadrat sampling
- 2 species existing within given env depends on potential interactions between them.
-
+ Association: If 2 species typically found within same habitat.
- (e.g. predator/preys or symbiotic relations)
-
- Association: If 2 species typically not found within same habitat.
- Species typically show - association if competition exists for same resources
- Some parts of habitat better for some species than others:
-
Competitive Exclusion: 1 species
utilising resources more efficiently than another → dec. survival of other species -
Resource Partitioning: Both species
altering use of env to avoid direct comp. - If species do not interact, NO association & their distribution = indep of 1 another.
- Presence of 2 species within given env
determined using quadrat sampling:- Quadrat: Rectangular frame of known dimensions used to establish pop density
- Quadrats placed inside defined area in either random arrangement or according to a belted transect.
- # of individuals of given species countedor estimated via % coverage
- Sampling process repeated many times in order to gain a representative data set
- Quadrat sampling used for counting plants & sessile animals, but not useful for motile organisms.
- In each quadrat, presence or absence of each species is identified
- Allows for # of quadrats where both species present to be compared against total # of quadrats.
-
Chi-Squared Test: Determines if there is a stat. sig. association between distr of 2 species
- Identify hypotheses (H0 vs. H1):
-
H0: No sig diff between distr of 2
species (i.e. NO ASSOCIATION) - H1: Sig diff between distr of 2 species (i.e. ± ASSOCIATION)
-
H0: No sig diff between distr of 2
- Construct freq. table (obs vs. exp)
- Expected freq = (Row total × Column total) ÷ Grand total
- Apply chi-squared formula
- Ʃ(O - E)2 ÷ E
- Determine degree of freedom (df):
- df = (m – 1) (n – 1)
- m = # of rows; n = # of columns
- df should always be 1 with 2 species
- Identify the p value.
- p values indicate probability that relationship down to chance.
- p value should be
- if chi-squared > 3.8
→ reject H0 ; accept H1. - if chi-squared → reject H0 ; accept H1
-
If H1 accepted, determine which type of association the species have:
- If not usually in same habitat/quadrat
= negative - If usually in same habitat/quadrat
= positive
- If not usually in same habitat/quadrat
- Identify hypotheses (H0 vs. H1):

Energy Flow
- Autotrophs gather energy from sun or chem
processes to synth. org. comp. from inorg. comp. - Photosynthesis converts light energy into chem energy, which is stored in org. comp.
- Heterotrophs ingest these organic compounds in order to derive their chemical energy (ATP) via feeding off other organisms.
- Food chain: shows linear feeding relationships between species in a comm.
- Trophic Lvls: Position org. occupies within a feeding sequence (e.g. food chain).
- When org. comp. broken down via cell resp, ATP produced to fuel metabolic processes
required for growth and homeostasis. - A by-product of these chem reactions is heat, which is released from organism
- Not all energy stored in org. comp. transferred
via heterotrophic feeding, some lost by:- Being excreted in organism’s faeces.
- Remaining unconsumed as uneaten portions of food (e.g. bones, cellulose, etc)
- Chem energy produced by organism
converted into:- KE: (e.g. during muscular contractions)
- Electric: (e.g. during transmission of nerve impulses)
- Light: (e.g. producing bioluminescence)
- All these reactions = exothermic & release heat as a by-product.
- Living org’s can’t turn this heat into useful
energy, so released from org. & lost from
ecosystem (unlike nutrients, which are recycled - Hence ecosystems require continuous energy influx from an external source (i.e. Sun)
Biomass
- Energy transformations in living orgs never 100% efficient
- Most nrg lost to org. either in respiration, (released as heat), excreted in faeces (e.g. cellulose), or unconsumed (e.g. bones).
- 90% available nrg lost between trophic lvls & higher trophic lvls store less energy as C-compounds, so have less biomass
- Biomass: Total mass of group of organisms, consists of cells, tissues and c-compounds.
- Biomass + nrg ↓ along food chains with loss of CO2, H2O & waste products (e.g. urea) to env.
- Explains limits to # of trophic lvls:
- As higher trophic lvls receive ↓ nrg/
biomass from feeding, they need to eat more to obtain enough amounts - By eating more, they expend more nrg
(& biomass) hunting for food - If nrg to hunt > nrg from food
→ trophic lvl unfeasible
- As higher trophic lvls receive ↓ nrg/
-
Pyramid of Nrg: Graphical representation of amount of nrg at each trophic lvl of food chain.
- Units: Nrg/area/time (e.g. kJ m–2 yr–1)
- Pyramids of energy never appear inverted as some of energy stored in 1 source always lost upon transfer.
- Each level roughly 1/10 of size of
previous lvl. - Producers → 1º → 2º → 3º
Carbon Cycle
- Autotrophs convert inorg CO2 into org
comp’s (carbs, lips & prots) via photosynthesis - Autotrophs use CO2 for photosynthesis
→ [CO2] in org to atm (or water)
→ CO2 passively diffuses into autotroph as required:- In aquatic autotrophs, CO2 diffuses directly into autotroph.
- In terrestrial plants, CO2 diffuses into autotroph through stomata.
- Heterotrophs can’t synthesise their own org comp’s, so obtain org comp’s via feeding
- All organisms produce nrg needed to power metabolic processes via cell respiration.
- Build up of CO2 in respiring tissues creates [grad] → removed by passive diffusion
-
Compensation Point: Net CO2 assimilation = 0
(Photosynth in auto’s = Respiration in hetero’s) - If net photosynthesis > cell respiration occuring in biosphere, atm [CO2] should drop.
- If net respiration > photosynthesis occurring in biosphere, atm [CO2] should rise.

CO2 in H2O
- Oceans = major C-sink & absorb most of anthropomorphic CO2 emissions.
- CO2 solubility = temp-dependent (+ soluble when cooler) → ↓CO2 absorbed as temps ↑
- Oceans absorb atm [CO2]:
- Some remains as dissolved (g)
- Most combines with H2O:
CO2 + H2O ⇄ H2CO3 - Which dissociates:
H2CO3 ⇄ HCO3¯ + H+
- H+ produced lowers ocean pH & so dissolved [CO2] ∝ H+ produced / acidity.
- Since start of industrial revolution ocean pH↓.
- Molluscs & coral reefs also absorb dissolved CO2 & CO32¯ in rocks & combine them with Ca2+ to produce CaCO3 used to form hard coral exoskeletons & mollusc shells.
- H+ (from H2CO3) combines with CO32¯ to reform acid, which dec. free CO32¯ in H2O, so molluscs + corals less able to produce CaCO3.
- Shells + coral exoskeletons that do form likely thinner & dissolve if ocean conditions + acidic.
- Hence inc. [dissolved CO2] threatens viability of coral reefs & molluscs.
- Coral reef disapp → loss of shoreline protect.
& habitat, altering coastal ecosystems. - ↓ revenue from tourism & food industries predicted to cost economies trillions.
- ↑ dissolved [CO2] in oceans → invasive algae species to flourish (more photosynthesis).
Methanogenesis and Methane
-
Methanogens: Archaeans (prokaryotes) that produce methane (CH4) as a metabolic by-product in anaerobic conditions including:
-
Waterlogged soils
(e. g. swamps and marshes) -
Marine sediments
(e. g. in the mud of lake beds) - Landfill sites (high pressure)
-
Digestive tract of ruminant animals
(e. g. cows, sheep, goats)
-
Waterlogged soils
- Methanogens produce CH4 from via anaerobic digestion of CH3COOH & CO2:
- CH3COOH → CH4 + CO2
- CO2 + 4H2 → CH4 + 2H2O
- CH4 builds underground or diffuses into atm.
- Org matter buried in anoxic conditions (e.g. sea beds), forms natural gas (i.e. CH4) underground
- [CH4] affected by:
- Rising # of domesticated cattle likely inc.
[CH4] being released into atm. - CH4 produced from organic waste in anaerobic digesters not allowed to escape, instead it is burned as a fuel.
- CH4 naturally oxidised to form CO2 + H2O (CH4 + 2O2 → CO2 + 2H2O)
→ short life-cycle → atm [CH4] low
despite lots made.
- Rising # of domesticated cattle likely inc.
Peat and Fossils
- Saprotrophs decompose detritus in soils &
return nutrients to soil (recycles nutrients). - Decomp requires O2 (cell resp. needed to fuel digestive reactions)
- Waterlogged soils may lack oxygenated air spaces, thus possess anaerobic conditions
- Anaerobic respiration by organisms in these regions produces organic acids (e.g. ethanoic), resulting in acidic conditions
- Saprotrophs can’t function effectively in anaerobic/acidic conditions
→ prevents decomp. - Lots of compressed partially decomposed organic matter form C-rich acidic peat.
- When peat deposits compressed under sediments, heat + press force out impurities & remove moisture, producing high [C] coal.
- Burial + compaction of org. matter under deposited sediments (e.g. clay/mud) cause org matter to be heated & hydrocarbons to form,
which form oil and gas, which are forced out of source rocks & accumulate in porous rocks.(e.g. sandstone) - FF formation takes place over long time, making them non-renewable nrg source.
Carbon Fluxes
- Global carbon fluxes are very large, measured in gigatonnes (billion tonnes)
- Due to carbon fluxes being large & based on measurements from many diff sources, estimates have large uncertainties.
- Main factors for C exchange (DOLCE FFIC):
- Deforestation will reduce removal of atm CO2 via photosynthesis
- Oceanic temps also determine how much C stored as dissolved CO2 or as HCO3¯
- Inc. # of ruminant livestock (e.g. cows) will produce higher levels of CH4.
- Climate events (e.g. El Niño, La Niña) change rate of C-flux ocean ⇔ atm
- Volcanic Eruptions release C-comps from Earth’s crust into atm.
- FF burning releases CO2 into atm.
- Forest fires release high [CO2] when plants burn (loss of trees also reduces photosynthetic C-uptake)
- Melting of polar ice caps → decomp of frozen detritus → releases CO2 + CH4.
- Atmospheric [CO2] measured at Mauna Loa Observatory (in Hawaii) since 1958 by Charles Keeling:
- [CO2] fluctuate annually/seasonally.
- Global CO2 trends conform to northern hemisphere patterns as it contains more of planet’s land mass (i.e. more trees)
- [CO2] steadily inc. since industrial revolution (due to inc. burning of FF’s).
- Atm [CO2] currently at highest recorded since measurements began.
Greenhouse Gases
-
Greenhouse Gases(GG): Gases that absorb LW
radiation, but let SW radiation pass through.
GG’s with largest warming effect within atm:
-
H2O(g):
- Created via evaporation of bodies (e.g. oceans) & transpiration
- Removed via precipitation & CO2
-
CO2:
- Made by cell resp. & biomass (e.g. trees & FF) combustion.
- Removed via photosynth. & absorption by oceans
-
CH4: Emitted from waterlogged soils, landfills,
(g) product of ruminants, permafrost melting. - NOx: released naturally by certain bacteria & artificially in exhaust by certain vehicles.
[CO2]: [GG] inc. most rapidly in atm is CO2 due to
combustion of FF.
- When FFs combusted to release nrg, CO2
released as a by-product. - Inc. more amounts produced by human’s inc. reliance on FFs following industrial revolution.
- Efforts to reduce reliance on FFs involve
exploiting alt nrg sources (e.g. solar power).
Greenhouse Effect
-
Green Eff: Natural process whereby atm traps & retains heat to prevent temp fluctuations & ensure Earth maintain moderate temps needed by organisms to maintain life processes.
- Insolation = SW radiation, which is absorbed by Earth’s surface, & re-emitted as LW radiation.
- GG absorb & re-radiate LW, hence retaining heat within atm.
- Without green eff, Earth’s temps would drop sig. at night in absence of direct sunlight.
- While GG’s occur naturally, man is inc. GG
emission via (DAT):- Deforestation: Tree removal → less CO2 removed from atm via photosynth.
- Transport: More people = more cars
- Inc. Agriculture: Involves land clearing for cattle grazing & ruminant cattle producing CH4
Global Warming
- GGs retain heat & so main contributor to GW.
- Inc. in [GG] should therefore correlate with an inc. in global temp.
- Long-term weather patterns (climate) may also be influenced by [GG].
- Scientists predict that inc. in [GG] will lead to Enhanced green eff (EGE), resulting in:
- More freq. extreme weather conditions (e.g. heat waves, cyclones, more powerful tropical storms, etc.)
- Some areas becoming + drought prone, whilst other areas becoming + prone to longer + heavier rainfall periods.
- Changes to circulating ocean currents →
longer El Niño (warming) & La Niña
(cooling) events. - But effects = hypotheses, so uncertain.
- Link between global temps & [CO2] established by analysing data over long time period using ice cores taken from Antarctica.
- Ice cores provide evidence of the env
conditions at time of freezing - By analysing gas bubbles trapped in ice, historical [CO2] & air temps (via oxygen isotopes) can be deduced
- Data collected from ice core show that:
- Strong + correlation between [CO2]
& temp (↑ [CO2] ∝ ↑ temperature) - Existence of fluctuating [CO2] cycles which appear to correlate with global warm ages & ice ages.
- Current [CO2] highest in recorded history.
- Strong + correlation between [CO2]
- Ice cores provide evidence of the env
- Industrial revolution introduced new processes that sig. inc. man’s FF use.
- FF burning releases CO2 as by-product, leading to steady inc. in its atm [CO2]
- When fuel emissions, atmospheric CO2 concentrations and global temps
compared, trends are revealed:- Strong + correlation between inc. FF emissions & rising atm [CO2].
- Atm [CO2] inc. sig. since pre-industrial age
- Nearly half of CO2 emissions remained in atm. (rest absorbed by sinks).
- Inc in atm [CO2] correlates with inc. in average global temp.
- Whilst correlation ≠ causation, mounting evidence suggests CO2 emissions linked to global temp changes, but other factors likely also contribute, such as:
- Milankovitch cycles in Earth’s orbit.
- Variation in sunspot activity.
Water Transport in Plants
- Water transported in xylem tissue.
- Xylem walls are thick & impregnated with lignin, which is strong & allows xylem to withstand low pressures without collapsing.
- When mature, xylem cells are nonliving, so flow of water among them → passive process.
- Pressure inside xylem vessels usually < atm.
pressure, but rigid structure prevents xylem vessels from collapsing. - Water pulled up from xylem in continuous stream because:
- Cohesion: H2O molecules = polar; & delta - charge on O atom in 1 H2O molecule attracts H in neighbouring H2O molecule.
- Adhesion: H2O molecules also attracted to hydrophilic parts of xylem cell walls.
- Adhesive property of H2O & evaporation generate tension forces in leaf cell walls.
- When H2O evaporates from wall surface in leaf, adhesion causes H2O to be drawn through cell wall from xylem vessels in leaf veins.
- Even if press. in xylem already low, force of adhesion between H2O & cell walls in leaf strong enough to suck H2O out of xylem, further reducing press.
- Transpiration Pull: Low press. of xylem generates pulling force that’s transmitted through H2O in xylem vessels down stem & to ends of xylem in roots.
- Energy for this comes from heat that causes transpiration (no extra energy needed)
- Pulling of water upwards in xylem depends on cohesion that exists between water molecules.
-
Cavitation: Liquids unable to resist low press.
in xylem vessels & liquid column breaks (occurs with most liquids, unusual with water). - Water travels in xylem along 2 pathways:
- Apoplast Pathway: Water travels xylem from cell wall to cell wall
- Symplast Pathway: Water travels xylem through cytoplasm to cytoplasm.
Water Absorption from Soils
- AT of mineral ions in roots causes absorption of water by osmosis.
- Mineral ions only absorbed by AT if they make contact with appropriate pump protein. This can occur by diffusion, or by mass flow when H2O carrying ions drains though soil.
- Some ions move through soil very slowly because ions bind to surface of soil particles.
- To overcome this, fungi grows on surface of roots and sometimes even into cells of root.
- Hyphae grow out into soil, absorb slow-moving ions like phosphate from soil, then supply ions to roots.
- Most of these plants supply sugars & other nutrients to fungus, so both fungus & plant benefit.
Xerophyte Adaptations
-
Xerophytes: Plants adapted to growing in deserts and other dry habitats. They do this by:
- Inc. rate of water uptake from soil.
- Dec. rate of water loss by transpiration.
- Some xerophytes have short life cycles completed by brief period when H2O available after rainfall. They then remain dormant as embryos inside seeds until next rains.
- Others are perennial and rely on storage of water in specialised leaves, stems or roots.
- Most cacti are xerophytes:
- Spines instead of leaves prevent transpiration.
- Stems contain H2O storage tissue &
become swollen after rainfall. - Pleats allow stem to expand & contract in volume rapidly.
- Epidermis of cactus stems has thick waxy cuticle.
- Stomata in plant stems (unusual), but spaced more widely than typical in leaves.
- Stomata also open at night rather than at day, when it’s cooler & transpiration occurs more slowly.
- Crassulacean Acid Metabolism (CAM): CO2 absorbed at night & stored in form of malic acid, which releases CO2 during day, allowing photosynthesis even when stomata is closed.
- Marram Grass is also a xerophyte:
- Rolled leaf, which creates localised env. of H2O(g) that helps to prevent H2O loss.
- Stomata sit in small pits within curls of structure, which make them less likely to open & to lose water.
- Folded leaves have hairs on inside to slow or stop air movement, much like many other xerophytes.
- This slowing of air movement once again dec. amount of H2O(g) being lost.
Halophyte Adaptations
Halophytes: Plants adapted to saline soils.
- Leaves are reduced to small scaly structures or spines.
- Leaves shed when H2O scarce & stem turns green & takes over function of photosynthesis when leaves absent.
- H2O storage structures develop in leaves
- Thick cuticle & multiple layered epidermis.
- Sunken stomata
- Long roots, which search for water.
- Structures for removing salt build-up present.