ECG Flashcards
System to analyse ECG
Rate
Rhythm
Axis
P wave
P-R
QRS length
QT
T wave
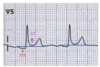
How to calculate rate
300 divided by big squares between 2 QRS
OR
count 30 large boxes (6seconds)
count the no. of R-R interval
Multiply by 10
How to tell axis on ECG
Leaving- LEFT axis deviation
Reaching- RIGHT axis deviation
P wave normal measurements
<2.5 squares high
<3 small squares wide
Normal PR length
3-5 small squares
QRS normal length
<3 small squares
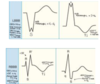
How to tell if it is a Q wave
negative deflection before an R wave
If no R wave, assume it is S wave
Q wave a sign of
cardiac damage - prvs MI
normal in limb leads
Should be less than a quarter of depth of QRS otherwise pathological
How to tell if Q wave pathological
normal in limb leads
Should be less than a quarter of depth of QRS otherwise pathological
ST elevation a sign of
infarction if more than 1mm
ST depression a sign of
ischaemia if > 0.5mm
Where to expect downward T waves
aVR
V1
sometimes III
Normal amplitude of T wavs
<5 mm in limbs
<10 in chest leads
Peaked T wave a sign of
hyperkalaemia
T wave inversion a sign of
Ischaemia
What is a prolonged QT
>440 in men
>460 mm in women
What does a QT of >500 ms increase the risk of
torsades de pointes

Causes of prolonged QTc
Low K, Ca, Mg
Low Temp
Drugs
MI
congenital
U wave
small deflection after T
delayed repolarisation of Purkinjee fibres

How big is a prominent U waves
>1mm or >25% of T wave
Causes of prominent u wave
Low HR, K, Temp

Inverted U wave causes

ischaemia
CAD
HTN
Regions associated with ECG leads

Lateral heart supplied by
LCX