Critical Appraisal in Respiratory Illness: Systematic Reviews & Meta-analyses Flashcards
What is a systematic review?
- SR of RCT is highest level of evidence*
- literature review focused on a single question
- identifies, appraises, selects, and snythesizes high-quality evidence relevant to that question
- criteria for review are well defined and objective
- can review both clinical trial and observational data
*a well-designed systemic RCT may be better at answering a question than a review of RCTs not designed to look at that question
What is a meta-analysis?
- the statistical aspect of a systematic review
- not all SRs will have a MA
- analysis of the combined data from multiple studies
- derive a pooled (weighted average) of effect size
- studies that have more events of interest in a trial will contribute a greater weight
- purpose:
- to increase power in a study to resolve uncertainty and improve estimates of effect size (precision)
- to answer other questions
- eg secondary outcomes of an RCT for which there may have not been enough power to assess (RCT is directed to primary outcomes)
How are studies identified for systematic review?
- identification of a clear clinical/research question
- use PICOT parameters
- scouring of data sources
- MEDLINE, EMBASE, CENTRAL, CINAHL, DARE
- reference lists
- grey literature publications from health organizations (AIHW, Diabetes Aus)
- RCT registry
- based on strict, objective inclusion/exclusion criteria
- in line with the question being addressed (PICOT)
- other parameters eg sample size (>1000 subjects; arbitrary and limiting)
- be wary of introducing bias (eg sample >1000 might limit to only large centres; only englihs studies)
How are studies selected and appraised for systematic review?
- undertaken by at least 2 independent people
- reading all abstracts of the identified studies
- application of objective inclusion/exclusion criteria
- full papers obtained and assessed for quality
- discussion and resolution of dicrepancies between 2+ reviewers
How are studies assessed for quality in a systematic review?
- CONSORT checklist to see how well each part (abstract, intro, etc.) of the study has been described
- CONSORT flowchart to assess selection bias of participants
- ie systematic differences between participants who contribute data and those who do not
- assessment of risk of bias (and confounding)
- using guidelines from the Cochrane Collaboration
How are studies synthesized in systematic review?
- meta analysis using statistical software
- quantitative component of SR
What are the key statistical issues in a meta analysis?
- outcome: weighted average of effect size
- can be relative (RR or OR) or absolute measure (mean difference)
- weighting of individual studies
- sample size, inverse variance, larger studies contributing more weight, more outcomes contributing more weight
- heterogeneity: variability in effect sizes
- assessed with chi-square test, fixed effects or random effects modelling
- MA should incorporate non-heterogeneous studies ie studies that are not different
What is a forest plot?
representation of the results of meta analysis
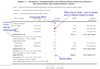
What is the pooled effect on a forest plot?
- combined result of all included studies

What does a smaller standard error of the log-rate ratio indicate?
- indicates less variability within a study
- typical of larger studies
- usually these studies contribute more weight in the meta analysis
- tf see a correspondence between the SE of the rate ratio and each of the weighting percentages given to the studies in the MA

What is the central line of a forest plot?
- line of null effect
- for rate (pooled result is a relative outcome) the null effect is 1
- for an absolute measure of the pooled effect (eg change from baseline), the null effect is 0

How is the rate ratio expressed on a forest plot?
- a point estimate (dot or square) relative to the central vertical line of null effect
- 1 for relative/rate, 0 for absolute/differences
- from each dot or square is a horizontal line that indicates the confidence interval
- size of dot or square is related to size of the study/component study

How is the pooled result indicated on a forest plot?
- for subgroup pooled result and overall pooled result
- indicated by a diamond
- middle point is the point estimate
- tips on either side represent the confidence interval

How is the test of heterogeneity indicated on a forest plot?
- results of the Chi2 test, under each subgroup analysis and the total analysis
- non-significant heterogeneity (p>.05) means that the studies are not heterogeneous (ie not different) and likely similar enough to be combined
- significant p values would indicate heterogeneity
- gives less confidence in the pooled result because the component studies statistically differ

What does the validity of systematic review and analysis depend on?
- relies on whether component studies are similar (ie non-heterogeneous) enough to be pooled
- assessed quantitatively, by statistics (eg test of heterogeneity) of effect sizes and variance
- cannot objectively assess non-statistical or situational/circumstantial heterogeneity
- ie to what extent are component studies different in their circumstance
- PICOT parameters, year conducted
- subjective call
- can have statistical non-heterogeneity but if studies are conducted in 1974, 2002, and 2014 you might establish that they are too heterogeneous to combine
- ie to what extent are component studies different in their circumstance
