Confidence Interval Estimation Flashcards
what is the central limit theorem?
As n→∞, the distribution of the sample mean becomes Normal, with centre µ and standard deviation σ/√n.
This happens regardless of the shape of the original population.
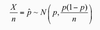
if X bar follows a Normal distribution then,
what is the size of n?
If the distribution of X is normal, then for all n the sample mean will follow a normal distribution.
If the distribution of X is VERY not normal, then we will need a large n for us to see the normality of the distribution of the sample mean.
In all cases, as n gets larger, the distribution of the mean gets more normal.
what are two types of estimators used to estimate population parameters?
Point estimate:
Interval estimate
Describe a point estimate
a single value or point, i.e. sample mean = 4 is a point estimate of the population mean, µ.
describe a confidence interval estimate
interval (range) created around the point estimate .
Includes the population parameter known
E.g. We are 95% confidence that the unknown mean score lies between 56 and 78.
what is the purpose of a confidence interval estimate?
indicates confidence of correctly estimating the value of the population parameter μ
allows you to say with specified confidence that μ is somewhere in the range of numbers defined by the interval
eg. 95% confident that the mean GPA at university is between 2.75 and 2.85
what do we want our estimators to be?
unbiased and consistent
what does it mean when an estimator is unbiased?
expected value of the estimator is the parameter we are trying to estimate
i.e E(X bar) = U
what does it mean when an estimator is consistent?
if the difference between the estimator and the parameter gets smaller as the sample gets larger.
what are ways to improve the estimator?
- take a larger sample size (increase n)
- Smaller variance as n→∞, means that sample mean should be “closer” to true parameter
point estimate is good but we…
would like some way to show how confident we are in our estimator.
in practice, what is the problem with increasing sample size (Increasing n) for the purposes of improving the estimator?
in practice, can’t keep increasing n indefinitely!
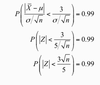
show what a 95% confidence interval for μ looks like
what does
95% confidence interval for μ refer to?
in repeated sampling, 95% of the intervals created this way would contain μ and 5% would not.
we can change how confident we are by changing?
are by changing the 1.96
Use 1.645 to get a 90% confidence interval
Use 2.33 to get a 98% confidence interval
what does this mean?
lIf the experiment were carried out multiple times, 95% of the intervals created in this way would contain μ.
lLCL: 0.78, UCL: 2.38
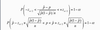
In general, a 100(1-α)% confidence interval estimator for μ is given by
<!--StartFragment-->
What does 100(1-α)% mean<!--EndFragment-->
If we want 95% confidence, α=0.05 (or 5%).
If we want 90% confidence, α=0.10 (or 10%).
If we want 99% confidence, α=0.01 (or 1%).
What does Zα/2 mean?
We want to find the middle 100(1- α)% area of the standard normal curve:
So the area left in each tail will be α/2.
Zα/2 is the point which marks off area of α/2 in the tail
<!--StartFragment-->
How can we change the width of the interval?<!--EndFragment-->
1. Vary the sample size: as n gets bigger, the interval gets narrower.
2. vary the confidence level: If we want to be more confident, then we simply change the 1.96 to another number from the standard normal, 2.33 will give 98% confidence, 2.575 will give 99% confidence; increasing confidence will make the interval wider.
what are useful z values?
what changes from sample to sample?
the INTERVAL that changes from sample to sample.
describe µ
µ is a fixed and constant value. It is either within the interval or not.
how should you interpret a 95% confidence interval?
In repeated sampling, 95% of such intervals created would contain the true population mean
i.e in repeated sampling, we would expect 95% of the intervals created this way to contain μ.
describe the other application of CLT
before we gather data, we know that we want to get an average within a certain distance of the true population value.
We can use the CLT to find the minimum sample size required to meet this condition, if the standard deviation of the population is known
we are estimating the length of my bus trip in the morning. Assume that the standard deviation of the trip length is 5 minutes. I want to estimate the true population mean length to within 3 minutes, with 99% certainty.
Step 1: set up the equation needed
P( |x̄ - μ| < 3 ) = 0.99
Step 2:
Step 3: solve for n.
P( |Z| < 2.575) = 0.99
develop the confidence interval estimate for u for a sample of n=25 boxes with mean 362.3g and standard deviation of 15
interval developed to estimate u is
362.3 +- (1.96)(15)/ (√25) or 362.3 +- 5.88
estimate of u is 356.42
is the interval for u always correct?
no, u does not necessarily have to be included in the interval developed from a sample
In practice, can you determine whether an interval estimate is correct?
no in practice, one sample is selected and the population mean is unknown and rarely known. Therefore, it cannot be determined whether an interval estimate is correct
for a higher degree of confidence of including the population mean within the interval,
you might need higher confidence levels such as 99%
other situations lower confidence is accepted such as 90%
what is the level of confidence symbolized by?
what is α representative of?
(1- α) x 100%
α is the proporation in the tails of the distribution that is outside the confidence interval. The proportion in the upper tail of the distrubition is α/2 and proportion in the l_ower tai_l of distribution is α/2
the value of Za/2 needed for constructing a confidence interval is called
95% confidence corresponds to an a value of….The critical Z value….
the critical value for the distribution
95% confidence corresponds to an a value of 0.05. The critical Z value….correspondding to a cumulative area of 0.975 is 1.96 because there is 0.025 in the upper tail of the distribution
level of confidence of 95% leads to z value of
1.96
99% confidence corresonds to an a value of
The z value is approximately
0.01.
the z value is approximately 2.58 because the upper-tail area is 0.005 and the cumulative area less than Z= 2.58 is 0.995
if the population of X does not follow a normal distribution, what ensures the X bar is approximately normally distributed when n is large?
The central limit theorem almost always ensures the xbar is approximately normally distributed when n is large
when there is a small population size and population does not follow a normal distribution, the sampling distribution of x bar is not normally distributed, then
the confidence interval is inappropriate
in practice, when can the confidence interval be used?
confidence interval can be used so long as the sample size is large enough and population is not very skewed to estimate the population mean when standard deviation is known
what does central limit theorem suggest?
know that by the Central Limit Theorem, as n→∞, the distribution of the sample mean becomes Normal, with centre µ and standard deviation σ/√n
This happens regardless of the shape of the original population.
i.e. X̄ follows a Normal distribution with E(X̄) = µ
var(X̄) = σ2/√n
relative frequency (also called sample proportion) is
an average: SUM / n
relative frequency of a category is the number of observations in that category divided by the total sample size.
when does CLT apply?
when sample is large enough
in particular case of binomial, what do we have?
We have X, the number of successes in n trials.
X/n = sample proportion of successes
Can be used to estimate p, the true probability of success
how large is large enough?
If the distribution of X is normal, then for all n the sample mean will follow a normal distribution.
If the distribution of X is VERY not normal, then we will need a large n for us to see the normality of the distribution of the sample mean.
In all cases, as n gets larger, the distribution of the mean gets more normal.
If we are dealing with a proportion, we would usually want n > 50, preferably larger than 100 before we rely on the Central Limit Theorem to tell us that p hat is Normally distributed.
what can proportions be viewed as?
sample averages
Which means the CLT will apply if the sample is large enough.
In general, this approximation (approximate normality) is good for n>50, and very good for n>100.
how do you estimate confidence interval for proportion?
how do you interpret results from confidence interval estimation of proportion?
That is, a 90% CI for proportion of cyclists is (0.6361, 0.6867). 90% of the intervals created in this way will contain the true proportion.
how do you determine sample size for the mean?
e being sampling error eg. sampling error of no more or less than +- 5
how do you determine sample size for proportion?
where you have no prior knowledge or estimate for population proportion P̄, what should you do?
assume p̄ = 0.5
results to largest possible sample size