chapter 3- Practical forecasting techniques Flashcards
(27 cards)
Thickness of a layer of the atmosphere is
a measure of how warm or cold the layer is; high values mean warm air, and low values mean cold air
Thickness can be calculated from
the heights reported on a radiosonde ascent, or a thermodynamic diagram
Thickness can be calculated by
subtracting the lower (height) value from the upper value, which always gives a positive number
Suppose 500 hPa height is 5407 m and 1000 hPa height is 23 m, what is the thickness of the layer 500‐1000 hPa?
The 500‐1000 hPa layer thickness = 5407 – 23 = 5384 m
In practical meteorology, the most common layers wherein thickness values are analyzed and forecast are:
500‐1000 hPa;
850‐1000 hPa;
700‐1000 hPa;
700‐850hPa
and 500‐700 hPa
The 500‐1000 hPa thickness also known as the
‘total’ thickness
The 500‐1000 hPa thickness also known as the ‘total’ thickness, is used to
define the broad average temperature for the lower half of the troposphere.
850‐1000 hPa:
This is useful for defining the temperature structure in the lowest 1500 m or so of the atmosphere, and can therefore be used in such things as rain/snow prediction, maximum temperature forecasting etc.
700‐1000 hPa:
Similar to 500‐1000 hPa but focused more on the lowest 3 km of the atmosphere, the layers nearer the earth’s surface.
500‐700 hPa/700‐850 hPa:
Used in studies of differential thermal advection, particularly when considering possible convection, degrees of instability etc
The use of 850‐1000 hPa thickness to forecast the
potential daytime maximum temperature has long been recognized
The use of 850‐1000 hPa thickness to forecast the potential daytime maximum temperature has long been recognized. For example
the relationship between 850‐1000 hPa thickness (h*) and the unadjusted maximum temperature (Tu), obtained for regions south of England, is:
Tu =‐192.65 + 0.156h*
For example, the relationship between 850‐1000 hPa thickness (h*) and the unadjusted maximum temperature (Tu), obtained for regions south of England, is:
Tu =‐192.65 + 0.156h*
An adjustment is then
added to this figure (Tu), depending upon forecast ‘cloud class’ and the time of the year.
The four cloud classes are:
- Class 0: Low and medium cloud generally less than half cover. High cloud not overcast. Fog only around dawn, if at all.
- Class 1: Roughly 50% cloudiness. If fog occurs, it clears slowly during the morning.
- Class 2: Mainly cloudy. If fog occurs, clears by midday, but slowly.
- Class 3: Mainly cloudy. If fog occurs, clears by midday, but slowly.
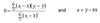
The empirical equation for forecasting maximum temperature (TMax) from 850‐1000 hPa thickness is of the form:
y=a+bx
where
y- Predictand, the variable whose value is to be predicted (e.g., TMax) and
x- Predictor, the variable whose value is used for prediction (e.g., 850‐1000 hPa thickness)
a- intercept
b- slope
The slope and intercept are estimated from
the historical data
The hypsometric equation tells us that
the thickness of a pressure layer is proportional to the mean temperature of that layer.
The hypsometric equation tells us that the thickness of a pressure layer is proportional to the mean temperature of that layer.
Thus,
an empirical relationship can be derived between the thickness of pressure layers and the occurrence of rain, snow, and freezing precipitation
Hank’s Rain‐Snow Relationship
It is an empirical rain‐snow relationship based on the 1000‐700 mb thickness
Hank’s Rain‐Snow Relationship
It is an empirical rain‐snow relationship based on the 1000‐700 mb thickness.
In this relationship,
a critical thickness value of 2480 m (for 1000‐700 mb layer) has been used to separate rain from snow effectively.
That is, if the thickness of 1000‐700 mb layer is:
- Less than 2480 m –mostly snow can be expected
- Greater than 2480 m –mostly rain can be expected
- Equal to 2480 m – 50% snow and 50% rain can be expected
That is, if the thickness of 1000‐700 mb layer is:
• Less than 2480 m –mostly snow can be expected
• Greater than 2480 m –mostly rain can be expected
• Equal to 2480 m – 50% snow and 50% rain can be expected
It is to be noted that
we need moisture and lift to produce precipitation. Thus, thickness values alone just provide a clue to the precipitation type, not the occurrence of the precipitation.
Rain‐snow Relationship
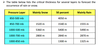
It is to be noted that

there will be some variation of these values with elevation. Essentially, as the elevation increase, the critical thickness value for rain versus snow also increases.