Chapter 2- Application of Theories Flashcards
(68 cards)
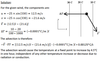
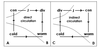
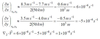
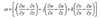
Horizontal divergence can be expressed as:

to compute horizontal divergence at (x0, y0) evaluate the derivative using the
central finite differences:

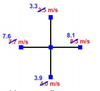
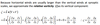
Example-1: Calculate the horizontal divergence for the data given in Figure. Given:
∆x=∆y=50km
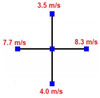
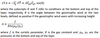
Example-1: Calculate the horizontal divergence for the data given in Figure. Given:
∆x=∆y=50km
Example-2: Repeat the above calculations with small changes (errors) in winds.
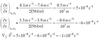
Divergence estimates using kinematic method areDivergence estimates using kinematic method are
very sensitive to small errors
Vorticity is a
microscopic measure of rotation at any point in a fluid
Vorticity is a microscopic measure of rotation at any point in a fluid. It may be considered to be
the local rotation of a fluid
Vorticity is a microscopic measure of rotation at any point in a fluid. It may be considered to be the local rotation of a fluid. Vorticity is a
vector field, which is defined as the curl of velocity
w=-/x V
where v =
(iu+ jv+ kw) is a 3d velocity field
-/x V =
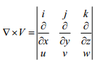
w=
Because horizontal winds are usually larger than
Relative vorticity has units of
of s-1 and vorticity is defined as positive in the counterclockwise direction
The Earth is rotating about its axis at rate
Ω (s-1).
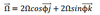
Since winds are defined
relative to the Earth’s surface, we express rotation about the Earth’s axis, in terms of those same coordinates, as:
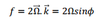
The vertical component of Earth vorticity is called the
coriolis parameter, f
Absolute vorticity is
the vector combination of relative vorticity (ζ) and Earth vorticity (f):
ζa = ζ +f
absolute vorticity of a fluid parcel is equal to
the sum of the (vertical) rotation of the fluid parcel relative to the earth (relative vorticity) and the vertical component of the rotation of the earth at that position.
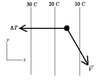
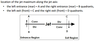
The gradient of a variable is
just the change in that variable as a function of distance
The gradient of a variable is just the change in that variable as a function of distance. For instance,
the temperature gradient is just the temperature change divided by the distance over which it is changing: /_\T//_\ distance
The gradient is a
vector and has a direction as well as magnitude.
Mathematically, the gradient vector is defined by

for example

The gradient of a scalar is
a vector whose direction is always normal to the isolines (contours) and pointing in the direction of increase