Chapter 12 Flashcards
(23 cards)
What are three ways to represent functions of two independent variables?
graphically, with a table of values, or an equation
What are three ways to represent multivariable functions graphically?
surface, cross section, contour diagram
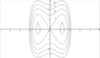
What would a contour diagram look like?
What does a right-hand axis look like in 3-dimensional space?

What does the xy-plane look like?
Green section:

What does the xz plane look like?
Orange section:

What does the yz plane look like?
Yellow section

What is the distance formula for 3-dimensional spaces?
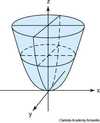
What does a paraboloid look like?
What do we need to do to get a cross section?
We need to take either x or y, and let one vary, while we keep the other fixed.
What could this be a contour diagram of?
Mountain Pass
What could this be a contour diagram of?
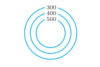
mountain peak
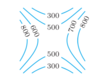
What could this be a contour diagram of?

long valley
Is this contour diagram possible? Why or why not?

No. Contour lines at different elevations cannot intersect.
When contour lines are drawn closer together for different “slices” (equal intervals) of z, what does that say about the function’s steepness?
As the contour lines are drawn closer, the steepness increases in the same direction?
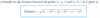
What is the equation for a saddle point?
z=y2-x2
What is the “slope-intercept” form of a linear function with 2 variables?
z = mx + ny + c
Where m is the slope along the x axis, n is the slope along the y axis, and c is the point on the z axis that is intercepted.
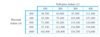
How can you tell a linear function from a table of values?
The columns and/or rows will have the same slope respectively.
Give an equation for a cone.
z2 = x2 + y2
Give an equation for a vertical cylinder.
x2 + y2 = r2
Give 2 possible equations for a parabolic cylinder.
x2 = z
y2 = z
Give the equation for a sphere.
x2 + y2 + z2 = r2
Give the equation for a paraboloid.
x2 + y2 = z
