Behavioral Science Flashcards

1
Q

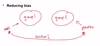
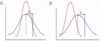
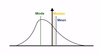
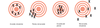
Look at the operator curve.

A

Curve A

This is b/c the sensitivity of the curve rises quickly when the specificity is close to 1. Specificity close/equal to 1 means it is a specific test. So, 1-specificity = 1-1 =0, so you want a high sensitivity close to the origin of the chart.

This means that the curve A test can predict well between disease and non-disease states.

Note: curve C has no predictive value

2
Q

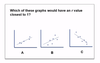
What diagnotic tools vary with prevelance of the disease? Which do not?

A

PPV & NPV vary depending on the prevalence of the disease.

Specificity and Sensitivity do NOT vary with the prevalence of the disease.

3
Q

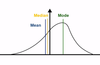
How do PPV and NPV vary with the prevalence of the disease?

A

PPV is directly proportional to the prevalence of disease (ie when prevelance is high, the positive predictive value is high as well)

NPV is indirectly proportional to the prevalence of the disease (ie when prevalence is high, the negative predictive value is low)

“NPV is Not Proportional to preValence”

4
Q
A

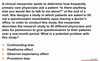
Specificity = TN/(TN+FP) = 108/120 = 0.9

NOTE: Easy to visualize if you draw a 2x2 square
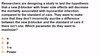
5
Q
A

Answer: 41%

How’d we get there?

There is a 0.9 chance of a test being true negative, and 0.1 chance of the test being a false positive. Each test is an independent event –>

probability of all 5 tests being negative = 0.9^5 = ~0.59

Now, we’re looking for the probability that one of the tests will not be positive or in other words not all the tests are negative –>

probability of not all 5 tests are neg = 1 - (0.9^5) = ~0.41

This means there is a 41% chance of having a positive test even if the patient does NOT have prostate cancer.

6
Q
A

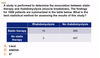
Sensitivity and specificity will be the same in either country b/c they are inherent to the test and are not effected by prevalence of disease.

PPV will be higher in China than US b/c higher prevalence in China

NPV will be lower in China than US b/c higher prevalence in China

7
Q

WHat is the equation to determine incidence?

A

Incidence = # of new cases/ total population at risk of becoming a new case during a specific time frame

Note: Those at risk would NOT include those who already have the disease or those who have had the disease and can not catch it again (ie chickenpox)

8
Q

Incidence x disease duration = ?

A

Prevalence ~= incidence x disease duration

So:

  • *In chronic diseases the prevalence > incidence** (b/c there are a lot of previously aquired cases that incidence doesn’t acount for)
  • *In acute (short-lived) diseases the prevalence ≈ incidence** (b/c most cases are new cases)
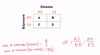
9
Q

Odds ratio = ?

A

Odds ratio = odds of exposure with disease/odds of exposure without disease = (a/c)/(b/d) = (ad)/(bc)

odds of exposure w/ disease = a/c

odds of exposure w/o disease = b/d

Note: Odds ratio approximates relative risk when the prevalence is low.

10
Q

What observational study uses odds ratio as a measure?

A

Case-control study

11
Q

What observational study uses relative risk as a measure?

A

Cohort study

12
Q

What does odds ratio asks?

A

What is the likelihood that a person w/ a disease had a certian exposure?

If the exposure is a potent cause of a disease the odds ratio will be much higher than 1.

13
Q

What does relative risk ask?

A

What is the probablity of getting a disease in the exposed group when compared to those in the unexposed group?
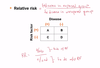
14
Q

relative risk =?

A

relative risk = fraction of those with disease who were exposed to the risk factor/fraction of those with disease who were NOT exposed to the risk factor

= [a/(a+b)]/[c/(c+d)]

15
Q

relative risk reduction measures what?

A

Relative risk reduction measures the proporiton of risk reduction attributable to the intervention as compared to the control.

16
Q

Relative risk reduction =?

A

RRR = 1 - relative risk

Remember, RR = [a/(a+b)]/[c/(c+d)]

17
Q

What’s the difference between Absolute Risk Reduction and Relative Risk Reduction?

A

Relative Risk Reduction is a proportion (RRR = 1 - RR)

Absolute Risk Reduction is a difference (ARR = Attributable Risk of the control – Attributable Risk of the intervention = (c/[c+d]) – (a/[a+b])

**Remember: **

Attributable Risk = Incidence in exposed group (%) – Incidence in unexposed group (%) = (a/[a+b]) – (c/[c+d])

18
Q

Precision =?

A

Precision is the The consistency and reproducibility of a test (sometimes referred to as the reliability).

With precision there is the absence of random variation in a test –> Random error/variation decreases the precision of a test

19
Q

Accuracy =?

A

Accuracy is measures how close test measurements are to the true values (sometimes referred to as validity)

With accuracy is the absence of systematic error or bias in a test –> systemic error decreases accuracy of a test

20
Q

Systematic error does what?

A

Systematic error reduces accuracy of a test by consistently skewing the results in a particular direction decreasing the validity

21
Q
A

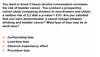
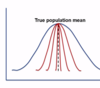
Answer is D - it has low accuracy and high precision due to systematic error.

You know it is low accuracy b/c the values are more than 30% above the gold standard value. They are precise b/c the values are clustered closely together.

22
Q

What is bias?

A

Bias is when an outcome is systematically favored over another –> causes systematic error (which reduces the accuracy of a study)

23
Q

Name 3 types of selection bias? At what phase in the study does selection bias occur?

A
  • Berkson bias—study population selected from hospital is less healthy than general population
  • Healthy worker effect—study population is healthier than the general population (ie ACL tears in competitive athletes)
  • Non-response bias— participating subjects differ from nonrespondents in meaningful ways

**Selection bias occurs during the recruitment phase. **

24
Q

What is a crossover study and why is it useful?

A

A cross over study is a study where the subjects act as their own controls. This is done by having 1 group as the control and the other as the exposed/experimental and then at some point in the study switching the two groups. So when comparing a patient rather than comparing them to a non-matched random person in the control group, you compare them to themselves when they were being treated as a control (ie w/ placebo, etc.)

This is particularly useful when trying to decrease the likelihood of a confounding bias.

25
Q
A

Hawthorne effect - changed behavior b/c know someone is observing.

The subjects are the physicians, but because the PI told them what she is looking for they are more likely to do the positive outcome (ask the question in this case) than not because someone is watching/observing.

26
Q
A

Confounding bias - When a factor is related to both the exposure and outcome, but not on causal pathway –> factor distorts or confuses effect of exposure on outcome.

In this case a confounding factor could be that drinkers also were more likely to smoke and smoking has an effect on bladder cancer –> cannot attribute a causal link between drinking and bladder cancer b/c smoking is a confounder.

27
Q

When comparing hte mean, median, and mode which is most effected by outliers?

A

Mean

28
Q

When comparing the mean, median, and mode which is least effected by outliers?

A

Mode

29
Q

When comparing the mean, median, and mode which is best found by charting a histogram?

A

Mode

30
Q

When determining the median of a even number of values what do you do?

A

Take the average of the two middle numbers.

31
Q

How will the Gaussian curve be changed if the test were very precise?

A

The curve would become skinner and taller b/c the standard deviation would decrease

Remember: Increase in precision –> decrease in std. dev.

Increase in precision –> increase in statistical power (1-Beta)

Also note, that just because the test is precise doesn’t mean it is accurate necessarily. Therefore even though the spread would be small the distribution would not necessarily reflect the population (look at image B)

32
Q

If the mean systolic blood pressure of a population was 130 with a standard deviation of 10, how many of a 100 member cohort will have BP greater than 140 (assuming a normal gaussing distribution)?

A

Answer: 16

This is b/c we know that 68% of the cohort (or 68 ppl) will fit within +/- 1st standard deviation. This leaves 32 subjects outside the 1st std. deviation. Now the end markers of the 1st std. dev are 120 and 140 (10 above and below the mean systolic BP given). Now a gaussian curve is symmetrical, so we will split it evenly above and below, thus 16 subjects will have BP < 120 and 16 subjects will have BP > 140. So the answer is 16.

33
Q

Standerd error of the mean = ?

A

SEM = std dev./sq root(n)

n= sample size

34
Q

Standerd error of the mean measures what?

A

**Standard error of the mean is an estimate of how much variability exists between the sample mean the and true population mean. **

You can’t measure everyone in a population –> you measure samples and get avgs of value. SEM compares the avg of the samples to the true population avgs.

Note: **SEM is inversly proportional to sample size. **So if n goes up SEM goes down.

35
Q

What is the relationship between standard error of the mean and sample size?

A

SEM and n are inversely proportional.

This make sense if you remember the formula for SEM (std dev/sq root(n)) <– bigger n –> bigger denomenator –> smaller SEM.

This also makes sense logically b/c a bigger sample size means the values are closer to the true values are the population, ie less spread and less error (the red lines in the image).

36
Q

Does sample size effect standard deviation?

A

No

37
Q

What could cause a bimodal distribution?

A

Two different populations (ie highest risk for STDs, suicide rates - young and old)

38
Q

What is a positive skew?

A

It is a distribution when there is assymetry with the tail lying on the right. Here mean > median > mode (think which is most effected by outliers, which is least effected?)

39
Q

What is this distribution known as?

A

Positive skew

40
Q

What is this distribution known as?

A

Negative skew

41
Q

What is a negative skew?

A

It is a distribution that is assymetrical with the tale lying on the left. Here mode > median > mean (think what is most effected by outliers, and what is least effected by outliers)

42
Q

With a positive or negative skew what is the best measurement to use (mean, median, or mode)?

A

In both, the median is the best approximation of the central tendancy.

43
Q

What is the probability of making a type I error or alpha error?

A

The probability of making a type 1 (alpha) error is equal to the p value.

44
Q

What is an alpha error?

A

An alpha error or type 1 error is falsely accepting the alternative hypothesis (ie there is an association between the disease and risk factor being investigated –> reject the null hypothesis).

Remember: Type 1 error = convicting an innocent man.

45
Q

What does a p value < 0.05 mean?

A

It means that there is less than a 5% chance that the data will incorrectly show an effect or difference when there is none.

The lower the p value the more confident one can be that the two populations are different.

46
Q

What is a type II error?

A

A type II (Beta) error is a failure to reject the null hypothesis when it is false (there is an association or difference identified).

Remember: Beta = Blind to the truth –> failure to convict a guilty man.

47
Q

How do you decrease the chance of a Beta error (type II)?

A

Increase sample size! This increases the likelihood of having a sample population that most closely resemebles the population of interest. This also reduces SEM.

It also increases the power of the study. There is POWER in numbers.

48
Q

What is power in epidemiological terms?

A

Power is the probability of rejecting the null hypothesis when it is actually false OR the probability of accepting the alternative hypothesis when there is actually a difference/association.

Power is aspect of the study itself - does it assess that which it sets out to assess?

THEREFORE:

A POWERFUL study is one that has HIGH LIKELIHOOD of detecting an effect or difference when one is present.

Power = (1 - Beta) = the likelihood of NOT making a type II error

49
Q

Power = ?

A

Power = 1 - Beta

(aka the likelihood of NOT making a type II error)

Remember: Increase in precision –> increase in power

50
Q

What are some ways to increase power and decrease probability of Type II (Beta) error?

A

1) Increase sample size
2) Decrease standard deviation
3) Increase precision
4) If the difference in mean values of groups (aka the size of the expected effect) increases it becomes easier to detect a difference –> so power will increase
5) Increase type I error (alpha and beta are inversely proportional - this makes sense b/c if you’re more likely to false accept the alternative hypothesis you’re less likely to incorrectly fail to reject the null hypothesis) - tradeoffs…

51
Q
A

Answer is C: 1 - alpha

Since the researchers want to decrease the likelihood of having an type I error –> maximize 1 - alpha

52
Q

What is a Z score?

A

A z score describes the distance that a particular data point is away from population mean in terms of standard deviations.

53
Q

What is a confidence interval?

A

A confidence interval is the range of values in which a specified probability of the means of repeated samples would be expected to fall.

The range encompasses the mean, z score, and SEM

54
Q

What confidence interval does a p value of 0.05 correspond to?

A

The 95% CI

55
Q

What is the Z value for a CI of 95%?

What is the Z value for a CI of 99%?

A

For the 95% CI, Z = 1.96.

For the 99% CI, Z = 2.58.

56
Q
A

C: Chi square test

The subjects are split into 2 groups and the outcome of interest is a categorical variables (has disease or doesn’t) so Chi square is the best option.

57
Q

What does the value of r of a Pearson correlation coefficient indicate?

A

Pearson correlation coefficient is a measure of the linear correlation (dependence) between two variables X and Y, giving a value between +1 and −1 inclusive, where 1 is total positive correlation, 0 is no correlation, and −1 is total negative correlation. It is widely used in the sciences as a measure of the degree of linear dependence between two variables.

Note: **r describes the fit of the data about the line, NOT the slope of the line itself. **

58
Q

What does a positive r indicate for a pearson correlation coefficient?

A

A positive r (1 >= r > 0) indicates that as one variable increases so does the other.

Example: As cardiac output increases so does stroke volume & their r = 0.99 (positive!)

59
Q

What does a negative pearson correlation coefficient (r) indicate?

A

A negative r (0 > r >= -1) indicates that as one variable increases the other variable decreases.

Example: As vascular resistence increases, blood flow decreases –> r = -0.99 (negative!)

60
Q

What is the r of this image?

A

r is around 0 indicating no linear correlation.

Note: r describes the fit of the data about the line, NOT the slope of the line itself. So while this slope is not flat, that does not factor into the r value.

61
Q

What is the coefficient of determination?

And what is it’s equation?

A

Coefficient of determination in a statistical model such as linear regreation represents the proportion of variability in a data set that is accounted for in a model. It ranges from 0 -1 (inclusive) and the closer to 1, the better the model fits the data.

Coefficient of Determination = r^2

62
Q
A

Answer: A

As an r = 1 indicates a high degree of linear correlation we want the data set with the data points most tightly clustered by the line. Image A has the most closely clustered data points to the line with a positive slope.

63
Q

…because the patient has medicare insurance you should offer them…?

A

ALL OF THE OPTIONS REGARDLESS OF INSURANCE!!!!

64
Q

A 6 mo old child is in the pediatrician’s office for evaluation. The child is able to sit unsupported, has a social smile, but doesn’t recognize his mother yet. What is the social and motor evaluation of the child?

A

Delayed socially, but normal motor development.

Motor: Rolls and sits unsupported (by 6 mo)

Social: Social smile (begins by 2 mo), should recognize people by 4-5 mo.