Autocorrelation & Forecasting Error Flashcards
(13 cards)
Forecasting Error

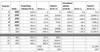
Which of the table headers in the image need to be summed as part of the MSE equation?
MSE
Which stands for: Mean Squared Error
Requires the sum of the values in the column named et2 to be divided by the number of time lags in the presented dataset.
Forecasting Error
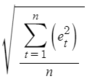
What forecasting error is depicted with the following formula?
RMSE
Which stands for: Root Mean Squared Error
Forecasting Error
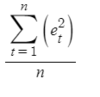
What forecasting error is depicted with the following formula?
MSE
Which stands for: Mean Squared Error
Note: MSE is also referred to as MSD (Mean Squared Deviation)
Forecasting Error Definition
RMSE
What does it stand for?
What is it used to determine?
How is it used?
RMSE stands for: Root Mean Squared Error
It is an estimator of a procedure/method that measures the standard deviation of residuals.
This value is a result of finding the square root of MSE (√MSE).

Forecasting Error Definition
MSE
What does it stand for?
What is it used to determine?
How is it used?
MSE stands for: Mean Squared Error
It is an estimator of a procedure/method that measures the average of the squares of the errors - the average squared difference between the estimated values and the actual value.
As a measure, it is always a positive value that demonstrates decreasing error as the value approaches 0.
Note: MSE is also referred to as MSD (Mean Squared Deviation)
True or False?
The autocorrelation coefficient measures the correlation between a variable, lagged one or more periods, and itself.
True.
This is determined by using the autocorrelation function (ACF): Corr(Yt,Yt-k).
The value of k is the time gap being considered and is called the lag.
Example: A lag 1 autocorrelation (where k = 1), is the correlation between values that are one time period apart.
What is the Ljung-Box test used to determine?
This test determined whether any of a group of autocorrelations of a time series are different from zero.
This test does not test for autocorrelation at each lag, it tests the “overall” relation based on a number of lags.
The number of lags, when referenced in this test. are referred to as the degree of freedom.
True or False
Based on the outputs below, the Box-Ljung test has been conducted for the given time lag = 1.
Why is this true or false?
Box-Ljung test
data: T1
X-squared = 21.7449, df = 1, p-value = 3.114e-06
Box-Ljung test
data: T2
X-squared = 0.2606, df = 1, p-value = 0.6097
Box-Ljung test
data: T3
X-squared = 1.5743, df = 1, p-value = 0.2096
True.
The outputs shown, display the results of the Box-Ljung test with df = 1. The df (degree of freedom) value is representative of the number of time lags being evaluated as part of the test.
True or False
Based on the outputs below, all of the results show significant autocorrelation up to lag = 1 at α = 0.05.
Why is this true or false?
Box-Ljung test
data: T1
X-squared = 21.7449, df = 1, p-value = 3.114e-06
Box-Ljung test
data: T2
X-squared = 0.2606, df = 1, p-value = 0.6097
Box-Ljung test
data: T3
X-squared = 1.5743, df = 1, p-value = 0.2096
False.
The outputs shown, display the results of the Box-Ljung test with p-values ranging from 3.114e-06 to 0.6097. Not all of the p-values demonstrate a significant autocorrelation.
True or False
Based on the outputs below, the T1 time series shows a significant autocorrelation up to lag = 1 at significance level α = 0.05.
Why is this true or false?
Box-Ljung test
data: T1
X-squared = 21.7449, df = 1, p-value = 3.114e-06
Box-Ljung test
data: T2
X-squared = 0.2606, df = 1, p-value = 0.6097
Box-Ljung test
data: T3
X-squared = 1.5743, df = 1, p-value = 0.2096
True.
The outputs shown for the T1 time series, display the results of the Box-Ljung test with p-value = 3.114e-06. This value is significantly smaller than α and therefore demonstrates a significant autocorrelation at α = 0.05.
True or False
Based on the outputs below, these are the results that test significance of autocorrelation at each particular time lag.
Why is this true or false?
Box-Ljung test
data: T1
X-squared = 21.7449, df = 1, p-value = 3.114e-06
Box-Ljung test
data: T2
X-squared = 0.2606, df = 1, p-value = 0.6097
Box-Ljung test
data: T3
X-squared = 1.5743, df = 1, p-value = 0.2096
False.
The outputs shown, display the results of the Box-Ljung test, which is a test used to determine the autocorrelation across multiple time lags, based on the supplied df (degree of freedom).
True or False
Based on the outputs below, these are the results that test significance of a set of autocorrelations for given data.
Why is this true or false?
Box-Ljung test
data: T1
X-squared = 21.7449, df = 1, p-value = 3.114e-06
Box-Ljung test
data: T2
X-squared = 0.2606, df = 1, p-value = 0.6097
Box-Ljung test
data: T3
X-squared = 1.5743, df = 1, p-value = 0.2096
True.
The outputs shown, display the results of the Box-Ljung test, which is a test used to determine the autocorrelation across multiple time lags, based on the supplied df (degree of freedom).
Using the first 5 observations in the data, compute the first order correlation (r1) and construct the 95% confidence interval for it.