4. One-Way ANOVA Flashcards
T-Test
Can only compare 2 means and can only be used with one predictor/independent variable. You should not compare several means using t-tests as it increases the chance of family wise errors. This is because each test has an alpha level of .95 and so each time you conduct another it increases the likelihood of a type one error (find an effect when there isn’t one). For example, conducting three t-tests with an α=.05 -> (.95)3 = .95 x .95 x .95 = .857. This means there is a 14% instead of a 5% chance of finding a false positive.
ANOVA
Compares several means (groups, conditions) and can have more than one independent variable. It is an extension of regression (the general linear model).
An ANOVA examines whether means differ between groups against the null hypothesis (means are the same). It’s an omnibus test which tells us that means differ overall but not precisely which means differ.
ANOVA as Regression
Using dummy coding, you can conduct an ANOVA as a regression getting the same results. Regression tests a model based on predictors, ANOVA tests whether experimental manipulation causes changes in the dv. They are different sides of the same coin. To dummy code, you create a new variable for every condition (except control) and code so that each other conditions is 0 and the chosen condition is 1. Then enter regression with DV as outcome and each dummy variable a predictors.
Dummy Coding
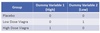
Theory of ANOVA
SST (how much variance there is between scores and grand mean, total variance), SSM (differences between grand mean and the group means, how much variability can be explained by the model) and SSR (the differences between the observed data and the model [group means], the unexplained variance). F ratio calculated by comparing the amount of variability explained by the model (MSm) to the error in the model (MSr). If more of the total variance can be accounted for by the model then can’t, then experiment is successful.
Follow Up Tests
These are needed to tell where differences lie between groups as an ANOVA only tells us about overall differences.
Planned contrasts: This is to be conducted when we make predictions ahead of the analysis (I.e. if we hypothesis groups will differ in a specific way). We achieve this comparison by comparing groups in chucks of two by coding them. Coding should always equal 0 (e.g. +1 +1 -2) and groups to be left out should be assigned a weight of 0. Positive weights are compared against negative weights. Multiple comparisons can be conducted testing all aspects of hypothesis.
Post Hoc Tests: These are done post hoc unplanned (not based on hypothesis). There are many types but in essence they compare each mean against all others (similar to t-test). However, they control for familywise errors by having stricter criterion for significance (alpha levels).
Trend Analysis: looks at trends and relationships (e.g. linear, quadratic).
Effect size: r value or omega squared (less biased as it takes df into consideration)
