3 - Interpreting the Results Flashcards
check out the error chart
- truth means the truth of the universe
- we don’t know this for sure
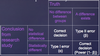
what is power (p-value)?
- p = 1-Beta (ie 80%) - lower right in chart
- the probability we have of making the correct decision that there is a difference when in fact a difference occured
what is the p-value?
- p-value means there is a statistical difference, reject null (generally if p <0.05) - NOT whether this difference is significant
- OR the probability of the observed result arising by chance
- people think this means there is an important finding, wrong
- a p value less than 0.05 is good, basically this is the probability that you will incorrectly conclude that the null hypothesis is false (make T2 error - ie B)
- tells you nothing about the probability of replication (reproducability) or magnature of an effect
- do not put too much weight on p-value (highly dependant on small n sizes - bc random sampling error can occur!)
what is the worst type of error?
Type 1 - false positive
what is a type 1 error vs type 2 error
1 - alpha - false positive (reject null even though null is true)
2 - beta - false negatve (fail to reject null even though reject null is true)
what is null-hypothesis significance testing?
- the idea of presenting us with a p-value in the article
what is confirmation bias?
- we see a result just bc we are looking for it
name/describe the 4 types of data, most often seen = *
- nominal: discrete categories w no order, dichotomous and categorical (y/n, dead/alive)
- ordinal: ordered categories w difference btw categories not assumed to be equal, categorical (mild, moderate, severe)
- interval: equal distances btw values and 0 is arbitrary, continuous (IQ)
- *ratio: equal intervals and meaningful q, continuous (height, rom, weight)
- ratio treated the same as interval
- don’t use ordinal much
what does it mean if out of 10 patients, every patient showed improvement but it is still not statistically significant?
- p value is not low enough to indicate a stat. sig. diff.
- just means that MAGNITUDE of change is not S.S. (if based on improvement/no improvement it would be)
* note that the state of reality cannot be changed, only the results of the null hypothesis sig. test can be changed
what should you be wary of when looking at null hypothesis significance testing (NHST)?
- look at effect sizes not p values ofr results (how diff are the groups and what is our confidence that they are different)
- pay attention to alpha and power
- use MCID when possible (ie are the results/differences meaningful to patients/clinicians)
- power can be ower bc of small n-size
what are the 2 important questions you should ask when interpreting the results?
1) what is the single value most likely to represent the truth? (effect size/summary measures)
2) what is the plausible range of values within which our true value may lie? (C.I. - how conifdent we are about summary measure)
- note we almost always find summary measures (best guess at validity)
what are some common summary measures? (3)
1) measures of central tendancy (mean, median, mode)
2) measures of dispersion (SD, SE, variance, range)
3) statistical tests (t-test, anova, ancova, regression, etc)
when do we use mean vs median vs statistical tests?
mean = with normally distributed data
median = not normally distributed, small n size, interquartel ranges
statistical tests - normally distributed data, larger n size
what is the difference btw anova and ancova?
- the only differnce is that ancova can adjust for certain things and anova cant, other than that just comparing btw 2 groups (ie if we want to adjust the score based on how someone is doing in the baseline)
what does a t-test compare?
- it compares btw 2 groups, where they probably used the mean or standard deviation and continuous data
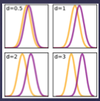
what is a common standardized effect size?
- cohen’s d
- difference btw 2 means/SD
- see yellow (control) vs purple (treatment)
- small = 0.2 SD, 0.5 med, 0.8 large
what are non-standardized effect sizes?
- mean (SD,SE) - for normal dist
- and median (25 and 75th quartile) - for non-normal dist
- t-test, anova, ancova, regression (normal dist)
- mann-whitney (non-normal dist)
What is incidence vs prevalence? - statistical tests? *DI*
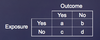
indidence: proportin of NEW events (AKA absolute risk) - (# of new events/number exposed) - for prospective studies!
prevalance: the proportion of events (# of events/number exposed) - for retrospective studies!
- tests = chi-square, regression
what is a case control study?
- follow people with event, don’t know incidence, see who was exposed to treatment or control
what are summary measures/effect sizes? (6) *DI*
- absolute risk reduction (ARR)
- number needed to treat (NNT)
- relative risk (RR)
- relative risk reduction (RRR)
- odds ratio (OR)
- survival
what is absolute risk? *DI*
- AKA risk - the event rate in the control group (baseline risk - risk in original group, incidence)
- incidence in group does not tell us anything about comparing btw groups!
what is absolute risk reduction? *DI*
- aka risk differnce
- absolute risk in control group - absolute risk in treatment group
- no effect, ARR = 0
what is number needed to treat NNT? *DI*
number of patients one would need to treat in order to prevent one event
= 1/ARR
- higher means not as effective!
what is relative risk RR? *DI*
- proportion of original risk still remaining after therapy - basically a fraction
- ARtx/ARct
- no indicatoin of what baseline risk was
- less than 1 means treatment more effective, 0.5 means risk of death cut in half (still no understanding for importance bc could be half of 20 or half of 1)
what is relative risk reduction RRR? *DI*
- proportion of original risk removed by therapy
= ARR/ARct = 1-RR
- ratio instead of difference
- recreate relative risk and odds ratio chart *DI*
- which is used for prospective vs retrospective?
- RR for prospective
- OR for retrospective
what is odds ratio? *DI*
- odds in experimental/odds in control group
- when will OR approximate RR? - when is OR a poor estimate of RR? *DI*
- good when incidence in control group or experimental group is low (baseline risk <10%)
- bad when baseline risk is high (>10%)
what is survival data?
- looking at incidence of death or disease recurrance over time (ie starts at 100% survival and decreases w time)
- interpreted similar to OR or RR
what is a hazard ratio?
- a type of survival data
- number of events over total observation time
what is CPHR (cox proportional hazard ratio)? *DI*
- a type of survival data
- statistical way to adjust for confounding factors for survival analysis
- ie adjusting for imbalances btw groups in baseline prognostic factors
describe how the CI is affected as time goes on for survival curves.
- CI is smaller earlier and gets larger over time bc n-size is decreasing as people are dying
- this is the same for comparing 2 groups (CI increases)
what happens if we decide to test more participants on a statistically non-significant effect (p<0.05)?
- more subjects = lower standard of error = smaller CI = greater chance of SS (can see effectiveness power better, meaning decrease random sampling error)
- eventually CI does not cross the no difference line, meaning p is significant
**this works assuming the effect size stays the same**
** if we have a systematic error it won’t be fixed by adding people to the study - increasing n size does nothing to effect size!**
describe CI wrt effect size
- a CI is the interval within which the effect size is likely to be found
- conventionally 95% CI (meaning 5% is left out so on either side of the curve p value is 0.025)
- see notes on p 33
what does power mean wrt increasing n-size?
- there is an increasing numbe rof events w increasing n-size
- therefore low chance of random sampling error
- if dichotomous outcome power increases as number of events increases
- in continuum, poer increases as sample size increases
- notes p 33
what does p-value tell you in terms of importance of differnce (if detected)?
- nothing
- if you have large n-size even small unimportant differnce can reach statistical significance
- if you have very few subjects even an important differnce may not reach statistical significance
clinically important difference? what to take into account? (3)
- a priori determination of magnitude of effect that would convince you to change your practice
- threshold for declaring something effective or non effective
- invasiveness to patient
- convenience to clinician
- staff cost
define difference btw clinically important and statistically significant? inderetminant or definititve?
- SS = p value less than 0.05
- CI = p value less than 0.05 but doesnt cross no differnce line
- indeterminant if lower limit of CI crosses no difference line
- definitive if it does
- p value could be the same for both of these!
what is equality?
- new treatment is no different than control (SS)
- relies on p-value for interpretation
- can’t give a clinical conclusion (be wary of people drawing conclusions form this)
- p 35 & 39
what is superiority?
- new treatment is better than old
- relies on a definition of superiority or better than (margin defined as what is better)
- may give CIs but no clinical interpretations boundary (no line!)
- p 35 & 39
What is non-inferiority?
- relies on def of non-inferiority/worse than (line defined as this)
- willing to accept some harm
- favours Ct but doesnt cross line
- opposite of superiority
- 36 & 39
what is equivalence?
- relies on both superiority and non-inferiority
- if CI falls btw 2 lines, say equal or the same as
- defines what these CIs look like on graph basically
- p 36 & 39
compare sample size and power analysis
- 36
SS = a priori, power known (80%), T1e known (5%), effect size known to estimate n
Power analysis = post-hoc, T1e known (5%), effect size known, n known to estimate power
look at n-size calculation components!
- just label them now
- p 37
- delta is the diff btw the groups
in n-size calculation, what is delta? how to find delta?
- defines the difference btw groups that the study is statistically able to detect (in denominator, so larger means smaller n-size needed)
- this is usually a small value, could try making value large to reduce n-size but then would need to assume that there would be a large effect!
- for delta should use MCID (within or btw group)
- find this with lit review or using coden’s D!
what results in a larger delta, within or between group MCID?
- within group (btw group is typically 20% of within group!)
check out sample problems on p 38
- slids 2 and 3
overall what does n-size calculation depend on (for all types of research q’s)?
- the expected effect wrt no effect line
what does the sample size equation look like for superiority/non-inferiority?
- m is added in the denominator (for the superiority/non-inferiority margin)
- p 40
what does the sample size calculation for equivalence look like?
- add m in denominator
- see p 41
see examples for n size calculation
- p 41 and 42
what are types of analysis that affect precision?
- independent comparison btw multple groups
- multiple independant outcomes
- multiple independant time points
- interim analysis
- subgroup analysis
how do multiple comparisons affect precision?
- in terms of multiple independant comparisons (of multiple gorups), independant outcomes (not multiple outcomes needed to answer one question though!), and time points
- increases our alpha ( more likely to produce false positive by chance!)
- check out example on p 43
what is subgroup analysis?
- determining whether there is a significant interaction effect
- ie a comparison of treatment outcomes for patients subdivided by baseline characteristics
when must a subgroup analysis be done?
- it must precede the analysis (a priori) or be recognised as hypothesis generating (post-hoc = hypothesis generating)
- for a priori it is preferred (need correction through for mutliple comparisons error)
- using subgroup decreases power
- how do you appropriately analyse/interpret subgroup analysis?
- it is not appropriate to test effect in subroups separately then compare, must look at everyone together
- using anova = simplest interacion test
for subgroup analysis how do we determine whether the magnitude of the effect is large?
- if n-size is small, may eb due to chance alone
- look at CIs to see if underpowered or conclusive
- meta-analysis might be more informative (avg estimate of effect across studies - increasing n-size)
how do you avoid false +ves for subgroup analysis?
- support by evidence/biological plausibility
- increase n size
- apply correction factor
- field at the time of application (A PRIORI!)
what is interim analysis? when is it done? (3)
- analysis conducted before completion of trial
1) efficacy (treatments are convincingly diff) - most common
2) futility (treatments convincingly similar)
3) harm (unacceptable side effects)
look at data safety and monitoring board slide
p 45
- what are some red flags involved w interim analysis? - what does interim analysis do to type 1 error?
- failint to plan ahead
- failing to report that study was stopped early
- selecting unsatisfactory criteria for stopping (must involve few looks/stringent p-values)
- p 46
- increases prob of t1 error bc lets say we have 2 interim analyses, thats 2 diff time frames for data analysis (also include 2 ind outcomes and 2 subgroup analysis), thats already 8 comparisons!! - see chart
look at example on p 46
- slide 3
how do you apply a correction factor for number of comparisons made?
- bonferroni correction (most common)
- 0.05/number of comparisons
- this is conservative
- basically saying want type 1 error to be 0.05 then i need p value to be less than 0.02 now when i do stat testing
what are spending functions?
- for stopping rules in interim analysis
- uside down triangle method = very hard to stop trials this way
- make 4 comparisons (look at data 4 times), p must be very small to stop for the first 3, 0.05 at 4th
look at exmaples for stopping interim
- p 47
- what is p-value dependant on?
- n size and number of events? double check this!
