Week 10: Fisheries Flashcards
(26 cards)
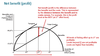
Describe the Gordon Schaefer Model?
Based on the size of fish population and growth rate.
Purpose of the model was to capture the effect of fishing on fish population.
- Bioeconomic model – used biological and economic factors.
Static model: ignors time dimension.
Population is measured at biomass (weight) à thus does not disinguish between number of individauls, size or age of fish.
From S to S*, population growth rate increases, small population size to available resources.
As S*à Sbar, population growth decreases, as larger population size relative to available resources.

Minimum viable population
- The point at which population growth rate turns negative
Carrying capacity
Where growth falls to zero.
How can we sustainably catch fish?
So long as the catch level equals the growth rate to the stock size, then the fish stock can be maintained.
Sustainable yield:
- The level at which the catch level = growth rate, S will remain the same.
Maximum Sustainable Yield (MSY):
The growth rate of population is maximised at S* (at which point, this will have the highest growth rate and catch level).
The cost model (i.e. fishing costs)
Measure fishing effort (in units)
- E.g. fishing hours, number of vessels, man-days etc.
- Primary assumption: the amount of fish caught per unit of effort is proportional to population size. à i.e. larger population, more fish caught per unit of effort (an increasing function of fish stock).
Cost of fishing effort: measured in $:
- Cost of running a boat (fuel, operating and labour costs)
Assumption 2: the marginal cost (per unit cost) of fishing effort is constant. I.e. each unit of fishing effort costs the same amount of money.
Benefits into the model:
Benefits of fishing (revenue): measured in $
- Money received for fish when sold
- Revenue = Quantity of catch * price
Assumption 3: Constant marginal benefit. The price of a unit of fish remains the same.
Benefits and Cost model:

Where is the net benefit (profit)?
Where do we find the maximum economic yield (MEY)
MEY is the amount of effort where net benefit (profit) is maximised.
- MSY would only coincide with MEY if the marginal cost of the effort was zero (i.e. total cost curve is horizontal)
In this case, lower levels of effort and larger fish population size than MSY.
REMEMBER, the curve for the population is reversed, when compared to benefits and cost.
What is the outcome if there is only one owner?
If you are the sole owner you will maximise profits. Therefore you will do E^e
When fish stocks are a private good
Will factor in future time periods.
What is the outcome in (open access) competitive?
No single fisherman can prevent other from exploiting the fishery.
(common good):
- Will increase catch levels until benefit = total costs.
Increase to E^C
Outcome of competition:
- No incentive to ‘save’ the resource for future time periods
- If the fisherman does not catch the fish today, someone else will catch it.
- Cannot secure future profits, thus only consider current profits.
- Rational market participants will exploit the resource, as no incentive to retain long term asset value.
- Ultimately – reduces future profits.
In addition:
- Too much effort is spent on too little fish.
- Fewer vessels could be employed, increase current profit.
- More fishermen increase total cost, but not total revenue
- At E^C no new entrants as no profit to be made (‘rent dissipation’)
Which outcome do we prefer?
Maximum sustainable yield is prefered.

What are the market failures in the fish market?
3 ones.
Inappropriate government intervention:
Negative Externalities:
Improperly defined property rights
How is Inappropriate government intervention a market failure?
Goal of policy has been to help fisherman, not an environmental concern.
- Not to recover and maintain fish stocks, but to ensure fishermen profit.
E.g. credits and subsidies for bigger boats
How does the fish market display negative externalities?
Bycatch
- Catching other wildlife
- Sea birds, turtles, dolphins, other fish species
Impact on habitat
- Trawling and dynamite fishing
- Pollution of fish nets
Changing the composition of ecosystem
Changing the balance of species can lead to reprecussions along the food chain.
Improperly defined property rights
Common good
Property rights are not defined.
What are the policies used to manage fisheries?
Output (Fish catch):
- Total allowable catch (TAC)
- Limits the maximum catch per species
- Landing fees
- Introduces payments per tonne of landed fish
- Individual (tradable) quotas
- Allocates shares of the total allowable catch to individual fishermen/fishery enterprises
- Slectivity criteria (age/sex)
- Establishes minimum size criteria
Input (fishing effort):
- Fishing licenses and capacity resporictions
- Technical restructions
- Bans on particular types of fishing
- Subsidies/taxation
- Fuel subsidies and support for modernization programmes.
Limits of number of fishing days.
What impact does technology innovation have on sole owner fisheries?
New technologies lower the marginal cost of effort:
- This results in the cost curve rotating to the right (becoming flattened)
Consequence:
- Increase in total effort
- Lower stock size
- Larger catch size
- Higher net benefit for the fishery.

What are the policy reactions to technology?
Restrictions placed on fisheries (i.e. fishing effort) to increase their cost of production.
- Increase in cost of effort (rotation to the left)
Example:
- Restriction of equipment use:
- Pacific salmon will spawn by swimming upstream
- Restriction on barricades and traps (increases cost of fishing)
- Restrictions on location and time
- Restricted to a few hours a day
E.g. 4 hours in Prince William Sound

What is the outcome of restrictions on technology?
Profit dissapears (rent dissipatio)
- Effort cannot be spread over time (limit)
- Forced through competition to buy larger and more powerful boats to take in more fish during the limited time.
In order to protect themselves:
- Fishermen were successful in banning new technologies à further increasing costs, but ensuring significant capital expenditure was not necessary to remain competitive.
Profits will not increase or change, due to ‘rent dissipation’
- Higher effort, and higher benefit, however these cancel out, net benefit is 0.
How do taxes work in fisheries management?
Raises cost of fishing.
- Rotates TC curve to the left.
- Can lead to the maximum economic yield (MEY)
- This is because tax revenue do not represent real-resource costs, but a transfer from fishermen to government.
- Net benefit is captured by society
Same outcome for fishermen.
Policy Scenario: Individual Transferable Quotas (ITQs)
How does it work?
What are the difficulties?
Different types of ITQs
Address property rights issue:
- Make property rights ‘well defined’ (i.e. exclusive and transferable)
Difficult as:
- Fish are a mobile resource, does not respect zonal boundaries
- Natural birth/mortaility
How does it work:
- Total allowable catch (TAC), based on the optimal harvest rate.
- An ITQ entitles a holder to harvest a specific weight of a specific type of fish, within a specific area.
- Sum all ITQs = TAC
- Quotas are allocated via auctioning or grandfathering
- Auction: government receives all the rent (e.g. Chile)
- Grandfathering: based on historical catch.
- Allowed to freely transfer
- Results in efficient allocation.
- Flows to those who benefit most:
- Those facing higher costs à sell quotas
- Facing lower costs à buy quotas.
Incentive to become more efficient (reduce costs).
Quota buy-back
- Buy from those selling their quotas
Examples:
- In NZ (1983)
- Fisherman nominates lowest price to leave
- Gov’t selects lowest compensation level.
Disadvantages:
- If industry anticipates a buy back, can increase capacity prior to buy-back
- Capacity may also increase over time after buy-backs
- Costly for government (needs to buy back quotas)
Alternative – Percentage share:
- Instead of quotas à establish a percentage-share of TAC
- TAC is determined annually, fisherman get a percentage of this TAC.
- Greater protection for fish, fishermen exposed to more risk.
Risk distribution:
- Envionrment and government are exposed to risk in Quota buy-back
Fishermen are exposed in percentage share.
How does Turf (Territorial Use Rights for Fishing) work?
Address: improperly defined property rights
TURFs are area-based fishing rights:
- Secure, exclusive rights to harvest fish in a certain area
- Typically assigned to a group
Basically legally recognised forms of traditional management
- E.g. Pacific Island nations: Samoa, Vanuatu
- Japan fishing cooperatives control feudal fishing rights
Difficult because:
- Fish tend to move, ideal for aballone (don’t move)
- Factors outside of TURF control (e.g. nutrients, pollution) are outside the control of TURF owner.
Solution:
- TURF can be assigned to all resources in a certain area.
Extention – International territorial use rights:
- UN Convention on the law of the Sea (1982)
- Property rights assigned to national governments
Territorial Sea: 12 nautical miles from coastline
What are CPRs?
How do they work?
A CPR is typical of a developing country:
- Property rights emergy from traditional arrangements
- Fishermen limit other’s access (informally)
- Restrict information (fish location)
- Actively defending fishing rights (sabotaging other rivals).
How do CPRs breakdown:
- CPRs operate like a cartel
- Fishermen have an incentive to defect and buy larger fishing fleets (no incentive to limit catch size)
- New technologies can disrupt traditional catch yeilds à push beyond sustainable level.
- Examples of CPRs: Yemen, Java, Thailand, India, Nicaragua (turtles), Zanzibar
Impact of Technology on CPRs:
- Positive impact:
- Has the potential to increase productivity
- Reduce catch variance
- Reduce effort
- Increase area and time when fishing can take place (eg. Deep water, rough water, etc.)
- Storage facilities smooth price variations
- Increase wealth of fishermen
- Negative impact:
- Increase income differences
- Owners of new boats are trapped into having to maintain expansive gear
- Loss of social cohesion
- Risk of overexploitation

