Structural Equation Modelling Flashcards
(26 cards)
Arrows
Curved - Covariance
Double headed arrow - covariance (as above)
Straight Line - Regression - directional pathway
Bivariate means…
2 variable
CMIN or CHi Squared
Looking for NON significance -
when it is a non significant result the model is a good fit
Error
The small circle with the e1 in it
What is not explained by what is coming in from any of the independent variables
error = 1 - r2
Errors
e.g. measuring happiness some variability due to happiness and some due to error, ie heat in room etc, question systematic error - the way i’s worded gives a higher score, random error
‘Global goodness of fit’ (N Biased)
Steps to tell if the MODEL FITS
The goodness of fit tells us how well the structural coeffcients “match” the bivaiate correlations
- Look at result or chi-squared is it significant? We are looking for a non-significant result for a goodness of fit
NULL hypothesis..they match or 0 difference which would mean a significant result for chi squared - the model is “significantly NOT” like the data
Goodness of fit indicators - other
1.Global Goodness of Fit (N biased)
–Chi Squared (must be non significant)
2.Absolute Fit Indices
–AIC, CAIC, BIC, Hoelter’s N (CN), ECVI, BCC
3.Incremental Fit Indices (baseline comparison)
–CFI, NFI, IFI, RFI
•GFI (.95) >NFI (.80-.90)
4.Parsimony Adjusted Fit Indices (less complex)
–PRATIO, RMSEA (< .05 or .08; the 95% CI should be less than .10), P/G/N/CFI
Indentification
and
Overidentification
Identification - is it a test?
If you want to interrelate 3 variables p=3 (2 IV’s & 1DV)
p(p+1) = amount of variance covariances which are the data
The total known amount of information will be 6 - so if I want to take arrows away that is fine (ie less) but if more it will get an erroyou ned more information than what you are asking for
Overidentification - is ok as you have asked for less that what is in the data
Underidentfication - is not ok where you ask fo more than ther data can offer
Latent Variables
Concepts that are hypothetical - they are latent in people at some level, they cant be directly observed, like intelligence etc - we can measure using observable indicators (e.g. questionnaire)
Mediation
Flow on effects - flowing through different towns etc
Mediation
Flow on effect can e direct or indirect relationship
Moderation
Interaction effects
Number on the arrows
the correlation between factor and indicator
e.g. box (indicator) arrow (number .77) round shape (DV - factor Happiness) Correlation between job satisfaction and happiness is 77% so as job satisfaction goes us so does happiness

r2 - r squared
the number sitting on the top right had side of the box
is the amount of variance of the DV explained by the IV (IV’s)
e.g 77% of the variation of current salary is explained by beginning salary
.77 or r2 comes from the Standardised BETA coefficient e.g. .88x.88 =77.4 =77%
SEM - mediation
interested in mediated effects - complex - or indirect effects - flow on through other variables
SEM - techniques involved in .. also known as
covariance structure analysis, latent variable analysis, confirmatory actor analysis (CFA) LISERAL; path analysis
SEM definition
SEM has 2 characteristics 1. Multiple IV’s and multiple DV’s 2. Represent factors (latent) as well as variables (manifest) (e.g. latent construct is “depression” underneath a whole lot of symptoms) 3. confirmatory focus on a theory you wish to test (path analysis using latent variables)
SEM suited to
Useful for more complex concepts and constructs and systems of relationships - it is modelling a causal system
SEM unpacks bivariate correlations into….
Direct effect (partital correlations) and ‘other influence pathways’ indirect effects
SMC’s (r2 ) - what is that?
that is the number to the top right hand side of the box whicch is the total amount of variance in the DV explained by the IV
Squared Multiple Correlations - like Pearson’s r
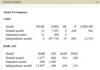
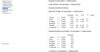
Standardised Regression Weights P Value
Looks at Regression Weights: p values (see image)
If it is not significant then the arrow does not exist
The Indirect Path Coefficient is?
The total correlation is?
The general rule is:
The product (multiply) of the indirect paths = the indirect pathway coeff between any two variables
The total correlation is then = Sum of Direct and Indirect coeffs presented in the particular path diagram.
(indirect (multiplied by directa) + (Directb)
e.g. .63 x .71 + .17= total correlation
.63 x .71 = indirect pathway coefficient
What are the structural coefficients?
The coefficient numbers on the line between each box
What are the total effects also called?
Bivariate Correlations
