Statistics Flashcards
(22 cards)
Measure of Central Tendency
- Mode – defined as the value that occurs most often. Best for data which is allocated into distinct categories (nominal data). The mode is the value which occurs most frequently in a given set of data.
- Median - defined as the value that occurs at the middle of all values of the variable (half are greater, half are less). not affected by extreme values. Good for all levels of measurement except nominal data. Especially good for skewed distributions
- Mean - defined as arithmetic average. The most frequently used measure of central tendency. Uses all values of data. Highly sensitive to extreme values (especially skewed distributions)
Variance
- the measure of the spread where the mean is the measure of the central tendency.
- Variance is the corrected sum of squares about the mean [σ (x − mean)2 / (n − 1)].
- The variance is a quantity equal to the square of the standard deviation
Standard deviation
- the square root of the variance (the use of the square root gives the same dimension as the data).
- For reasonably symmetrical bell-shaped data, one standard deviation (SD) contains roughly 68% of the data, two SD contains roughly 95% of the data and three SD contains around 99.7% of the data (Figure 1.2).
- A normal distribution is defined uniquely by two parameters,
- the mean
- the SD of the population.
- Other features of a normal distribution include that it is symmetrical (mean = mode = median) and that the data are continuous.
- The standard deviation is a quantity calculated to indicate the extent of deviation for a group as a whole.
Standard error (SE) of the mean
defined as the SD divided by the square root of the sample size. Used in relation to a sample rather than the population as a whole. It can be thought of as being equivalent to the SD for the true mean, i.e. 68% confidence that the population mean lies within one SE of the calculated (sample) mean, 95% confidence that population mean lies within two SEs of the sample mean, 99.7% for three SEs. The formula does not assume a normal distribution.
Confidence interval
two SEs either side of the sample mean determines the 95% CI of the mean (i.e. we are confident that the true population mean lies within this range of values).
Confidence intervals are preferred to P values (see below) because:
- CIs relate to the sample size;
- a range of values is provided;
- CIs provide a rapid visual impression of significance;
- CIs have the same units as the variable. When an unknown value is sought, the confidence interval gives the statistician a set of parameters within which the “true” value is located. The confidence interval is used to indicate the reliability of an estimate
Type 1 Error ( Alpha Error)
- A type I (α) error occurs when a difference is found, but in reality there is not a difference (i.e. a false-positive result, and therefore the null hypothesis is rejected incorrectly).
- This is one of those 5% of cases where the difference occurred by chance.
- We can protect against type I errors by reducing significance levels, although this increases the risk of a type II error occurring.
- Note that the risk of a type I error decreases as the acceptable P value is lowered, but then bigger study samples are needed in order to protect against a type II error.
Bonferroni correction
A Bonferroni correction is a post-hoc statistical correction made to P values when several dependent or independent statistical tests are being performed simultaneously on a single data set.
Type-II errors, or beta errors
- false-negative result, and therefore the null hypothesis is accepted incorrectly
- occur when the null hypothesis is accepted when it should be rejected.
- This often occurs when studies are underpowered. In the example above, the null hypothesis is that repair of the capsule does not reduce dislocations within the first three months. Since the first study did not show a statistically significant difference, the null hypothesis was accepted.
- Since a more powered study showed that repair of the capsule does reduce dislocations, the null hypothesis should have been rejected in the initial study (if it was adequately powered).
- We can protect against type II errors with statistical power. Note that type I and type II errors are related inversely. Type II errors are common in orthopaedic studies
A type III (γ)
error occurs rarely when the researcher correctly rejects the null hypothesis but incorrectly attributes the cause
Power of Study
- The study power is defined as the ability of a study to detect the difference between two interventions if one in fact exists
- The power of a statistical test is correlated to the magnitude of the treatment effect, the designated type I (alpha) and type II (beta) error rates, and the sample size n.
- The power is equal to (1-beta) whereby beta is the false negative rate
- The statistical power is therefore the probability that the test will correctly reject the null hypothesis
- Factors affecting power analyses
- Size of the difference between the means (the larger the difference, the easier it is to detect a difference and the greater the power).
- Spread/variability of the data (the larger the spread, the less likely a difference will be detected).
- Acceptable level of significance (i.e. the P value that is set).
- Sample size (power increases with increasing sample size).
- Experimental design (e.g. within subjects versus between subjects).
- Type of data (parametric versus non-parametric).
Non-parametric data are observations which can be expressed as a dichotomous (yes or no) outcome such as gender.
Features of non-parametric tests •
- No assumptions are made about the origins of the data.
- No limitations on types of data.
- Rank order of values.
- Less likely to be significant. Decreased power for a given n.
- Cannot relate back to any parametric properties of the data.
Parametric (continuous)
- Parametric data, such as age, are observations for which difference between the numbers have meaning on a numerical scale
Features of parametric tests ·
- Assumes the data were sampled from a normal population.
- Observations must be independent.
- Populations must have the same variance.
- Can use absolute difference between data points.
- Increased power for a given sample size (n).
Evidence-based medicine (EBM) is an approach to medical practice intended to optimize decision-making by emphasizing the use of evidence from well-designed and well-conducted research.
Five steps of EBM
- formulate an answerable question
- gather the evidence
- appraise the evidence
- implement the evidence
- evaluate the process
Different Levels of Evidence

- Level 1 Randomized controlled trial (RCT) - a study in which patients are randomly assigned to the treatment or control group and are followed prospectively
- Meta-analysis of randomized trials with homogeneous results
- Level 2 Poorly designed RCT - follow up less than 80
- Prospective cohort study
- (therapeutic) - a study in which patient groups are separated non-randomly by exposure or treatment, with exposure occurring after the initiation of the study
- Meta-analysis of Level 2 studies
- Prospective cohort study
- Level 3
- A retrospective cohort study a study in which patient groups are separated non-randomly by exposure or treatment, with exposure occurring before the initiation of the study
- Case-control study - a study in which patient groups are separated by the current presence or absence of disease and examined for the prior exposure of interest
- Meta-analysis of Level 3 studies
- Level 4 Case series - a report of multiple patients with the same treatment, but no control group or comparison group
- Level 5 Case report, Expert opinion, Personal observation
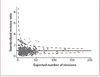
A funnel plot
- graph designed to check for the existence of publication bias;
- funnel plots are commonly used in systematic reviews and meta-analyses.
- In the absence of publication bias, it assumes that studies with high precision will be plotted near the average, and studies with low precision will be spread evenly on both sides of the average, creating a roughly funnel-shaped distribution.
- Deviation from this shape can indicate publication bias
Funnel plots
Funnel plots have the following characteristics: ·
- Each dot represents a single study.
- The y-axis is usually the standard error of the effect estimate.
- The x-axis shows the result for the study, sometimes expressed as an odds ratio.
- Larger studies with higher power are placed towards the top.
- Lower powered studies are placed towards the bottom.
- However, other measures could also be plotted (e.g. the reciprocal of the standard error, the reciprocal of the sample size, or variance of the estimated effect).
- The plot should ideally resemble a pyramid or inverted funnel, with scatter due to sampling variation.
- The shape is expected because the studies have a wide range of standard errors. If the standard errors were the same size, the studies would all fall on a horizontal line.
Funnel plots
- increasingly used in surgery to describe variations in performance between surgeons and/or centres, and identify outliers.
- They are scatter plots, with superimposed control limits (typically 2 SD, 3 SD or 4 SD).
- The smaller the size of the sample, the wider the control limits (increased variability).
- As the sample increases the certainty increases and the ‘funnel’ is formed.
- Data within the control limits are consistent with common cause variation or natural variation, whereas those outside these limits indicate unexpected good or bad results.
- The estimated rate of revision is calculated based on the number of primary procedures undertaken, with adjustment for patient factors (i.e. age, sex, diagnosis)
-
The standardized revision rate is a proportion of the observed revision rate divided by the expected revision rate.
- Control limits are set at 4 SD.
- Units above the control limit are achieving unexpectedly poor results, and those below are achieving unexpectedly good results.
- The outliers with poor results in this analysis were generally centres using a high volume of metal-on-metal articulations.
PROM
PROMs are standardized, validated questionnaires that are completed by patients’ during the perioperative period to ascertain perceptions of their health status, perceived level of impairment, disability, and health-related quality of life
Limitations - open to the interpretation, depends on who is asking, score many no be appropriate for the candidates testing
eg - DASH score
Kaplan- Meiers graph
Survival analysis -
- outcome of an intervension is plotted ovet a time
- which allows variable dares of entry
- Patient to be followed for different length of time
- it is a survivorship curve.
- The advantage is you can take a group of patients and monitor over a period of time and use it to calculate overall survivorship.
- It doesn’t matter when the patient enters the study, all will be analysed.
- At the start, there is 100% survival. nobody has died. Every time there is a death there is a vertical drop. Bigger the deaths/ dropouts, larger the drops. Until eventually I get to the end of the study.
- In orthopedics - outcome measure - survivor ship, analyse the population together and Calculate survivor ship.
- Revision - classed as a failure and classed as drop out.
- Horizontal is time and vertical is drop.
- Censoring - where there is a drop out of some sort of the study. Somebody dies / study was complete / lost to follow up, complete/lost to follow up.
- Or end of the study - by the end of five years they did not achieve the questions looking for.
- Right Censorship - they will not be able to complete the study.
- Left censorship - can not determine the exact date which they enter the study, can happen in cancer patients.
- Reason for censoring - they can cause skewing of the data.
- Good point - allowing us to interpret the data together and look at survivorship over a period of time.
- It allows us to compare the large group of people even if the operation is not done on the same day.
- Disadvantage - every time there is death / drop out - it increases the accuracy of the results.
- In orthopaedics - revision as the endpoint.

Measures of spread/variability
- Range: the lowest and highest values of the data. The range does not give much information about the spread of the data about the mean.
- Percentiles: groupings of data into brackets. Commonly this is groupings of 25% (known as quartiles), from which the interquartile range can be calculated.
- Variance: the measure of the spread where the mean is the measure of the central tendency. Variance is the corrected sum of squares about the mean [σ (x− mean)2 / (n − 1)].
- Standard deviation (⌧): the square root of the variance (the use of the square root gives the same dimension as the data). For reasonably symmetrical bell-shaped data, one standard deviation (SD) contains roughly 68% of the data, two SD contains roughly 95% of the data and three SD contains around 99.7% of the data (Figure 1.2). A normal distribution is defined uniquely by two parameters, the mean and the SD of the population. Other features of a normal distribution include that it is symmetrical (mean = mode = median) and that the data are continuous.
- Standard error (SE) of the mean: defined as the SD divided by the square root of the sample size. Used in relation to a sample rather than the population as a whole. It can be thought of as being equivalent to the SD for the true mean, i.e. 68% confidence that the population mean lies within one SE of the calculated (sample) mean, 95% confidence that population mean lies within two SEs of the sample mean, 99.7% for three SEs. The formula does not assume a normal distribution.
-
Confidence interval (CI): two SEs either side of the sample mean determines the 95% CI of the mean (i.e. we are confident that the true population mean lies within this range of values). Confidence intervals are preferred to P values (see below) because:
- CIs relate to the sample size
- a range of values is provided
- CIs provide a rapid visual impression of significance
- CIs have the same units as the variable.
Survivlal Analysis
- Survival analysis is often used in register studies to estimate the incidence of an outcome.
- The most commonly used survival analysis is the Kaplan–Meier survival curves, which present the proportion of patients who have not experienced the defined event (e.g. death or revision of a prosthesis) in relation to the time.
- Depending on the research question, competing events can be taken into account by using the cumulative incidence function. Cox regression analysis is used to compare survival data for different groups taking differences between groups into account
- In register studies, survival analysis is often used either to describe the incidence of an outcome by calculating absolute risk estimates, for example, absolute risk of revision or infection following the primary operation, or to compare the risk of an outcome between two different groups.
- The most commonly used survival analysis is the Kaplan–Meier estimator.
- The Kaplan–Meier estimator is functional as it allows for incomplete follow-up of patients, which occurs when patients are either lost to follow-up or are alive when the study ends without having experienced the outcome.
- In analyses of data from arthroplasty registers, the time intervals analyzed may represent the survival of implants, where the starting point is the date of the primary operation and the endpoint is the date of revision.
- Kaplan–Meier survival curves or plots present the proportion of patients who have not experienced the defined event (e.g. death or revision of prosthesis) in relation to the time.
