Re-Study Flashcards
In a long run, probability can be viewed as what?
The proportion of times an event happens, or its relative frequency.
What is a sample space?
A collection of all elementary results, or outcomes of an experiment.
What is an event?
Any set of outcomes, and a subset of the sample space.
A sample space of N possible outcomes yields how many possible events?
2n possible events.
What is the notation for the sample space?
The Capital Omega
What is the notation for the empty event?
Ø
What is the notation for the probability of the event E?
P{E}
A union of events A, B, C, is an event consisting of what? What word does this correspond to?
all the outcomes in all these events. It corresponds to the word or.
A complement of an event A is what? What word does it correspond to?
an event that occurs every time when A does not occur. It corresponds to the word not.
An intersection of events A, B, C… is what and corresponds to what word?
an event consisting of outcomes that are common in all these events. It occurs if each A, B, C, … occurs, and therefore corresponds to the word and.
A difference of events A and B consists of what, and corresponds to what phrase?
all outcomes included in A but excluded from B, and corresponds to the words “but not.” A but not B.
Events A and B are disjoint if
their interesection is empty
If any two events are disjoint in a set of events, they are?
Mutually exclusive
Another term for mutually exclusive
Pairwise disjoint
Events A B and C are exhaustive if
their union equals the whole sample space.
Occurrence of a mutually exclusive event does what?
Eliminates the chance of any other mutually exclusive event occuring.
A single event A and it’s compliment is a classical example of what?
A collection of disjoint, and exhaustive events.
If a collection of events is exhaustive then
One event must occur.
The compliment of a union of two events is
the intersection of the compliments of both events.
Notation for the difference of A and B
A/B
What is the sigma-algebra?
a collection of events whose probabilities we can consider in our problem.
What makes a collection of events a sigma-algebra on a sample space?
It includes the sample space.
It includes every event, and its compliment.
Every coutable collection of events in the sigma-algebra is contained along with their unions.
What is the minimal collection of a sigma-algebra?
The sample space, and the empty event.
What is the minimal collection of evens for a sigma-algebra known as?
The degenerate Sigma-algebra.
What is the power set of the sigma algebra, and what is its size?
The collection of all events and their unions. Its size is 2Omega
What is the sigma additivity problem?
for any finite or countable collection of mutually exclusive events, P{E1 U E2…..} = P(E1) + P(E2)…
What is the formal definition of probability?
Probability is a function of events with the domain sigma-algebra and the range [0,1] that satisfies the sigma-additive property, and the sample space has unit probability or P(sampel space) = 1.
What is the probability of an empty event?
0
The probability of an event is equal to what?
The sum of all of the mutually exclusive outcomes contained in that event.
Only what kind of events satisfy the Sigma-additivity property?
Mutually exclusive events.
How do you calculate the probability of events that are not mutually exclusive?

What is the compliment rule?
How do you calculate the probability of independent events?

When are events independent?
When the occurence of one event does not affect the probabilities of other events occuring.
What is the notation for the sigma algebra?

What is a random variable?
A variable that depends on chance.
What is a stochastic process?
A experiment model in which the random variables depend on time.
What is fundamental to correctly determining the likelihood of an experiment’s outcomes?
Precisely defining the experiment is fundament to determining
When can we say for certain the value of a random variable?
We can’t, we can only talk about the distribution or all possible values of a random variable with the likelihood of occurence.
What are the three interpretations of probability?
Classical, subjective or bayesian, and frequentist
What is the classical interpretation of probability?
We have an intuitive idea of probability and in some situations already know how to compute it. Such as rolling a 6 sided dice with equally likely outcomes.
What is the frequentist interpretation of probability?
We have an intuitive idea of probability in some situations that we do not compute on our own, but is based on past observations.
What is the subjective or Bayesian interpretation of probability?
Probability is a degree of belief. We have an intuitive idea of probability that may not fit the classical or frequentist interpretations.
What is an example of Bayesian interpretation of probability?
One in which the experiment can not be made, it is destructive. What is the probability of that bridge collapsing?
When do we say an event occurred?
When the outcome of an experiment is a member of that event.
An experiment will have how many outcomes?
Exactly one.
What does it mean that ¬A is relative to the sample space?
It means that ¬A includes everything in the sample space not in A.
What is the probability of each outcome when the sample space consists of n equally likely outcomes?
1/n
How is the probability of an event calculated?
(# of out comes in event)/(# of outcome in sample space) * for equally likely outcomes.
In reality most situations do not have what?
Do not have equally likely outcomes.
Equally likely outcomes are usually associated with the phrases
“fair game” or randomly selected.
Outcomes forming an event are often called what?
Favorable outcomes.
What does sampling with replacement mean?
means that every sampled item is replaced into the initial set, so that any of the objects can be selected with probability 1/n at any time.
What provides special techniques for the computation of favorable outcomes and total outcomes?
Combinatorics.
When sampling with replacement, the same object may what?
Be sampled more than once.
What does sampling without replacement mean?
every sampled item is removed from further sampling, so the set of possibilities reduces by 1 after each selection.
When are objects distinguishable?
if sampling of exactly the same objects in a different order yields a different outcome, that is, a different element of the sample.
When are objects indistinguishable?
if the order is not important, it only matters which objects are sampled and which ones are not. Indistinguishable objects arranged in a different order do not generate a new outcome.
What is an example of is an example of distinguishable objects without replacement?
A password.
How are permutations with replacement calculated?
Where n is the possible selections, and k is how many selections.

How are permutations calculated without replacement?
What are permutations?
Possible selections of k distinguishable objects from a set of n are called
How do you calculate combinations without replacement?
The numbe of permutations of k, n is equal to what?
the number of possible allocations of k distinguishable objects among n available slots.
What are combinations?
Possible selections of k indistinguishable objects from a set of n
What is an example of a combination?
An antivirus software reports that 3 folders out of 10 are infected, how many possibilities are there? Order in this case does not matter, A, B, C is the same outcome as B, A, C.
What is conditional probability?
event A given event B is the probability that A occurs when B is known to occur.
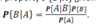
How is conditional probability denoted?

How is Conditional probability of A given B calculated?

How can Conditional probability of A given B be simplified to give us the probability of the general intersection?
How can independence be mathematically defined?
How do we know if events are independent?
If
is the probability of A given B equal to the probability of B given A?
What can be used to find
Bayes Rule
What is Bayes Rule?
What is independence?
Events A and B are independent if occurrence of B does not affect the probability of A
In the case of two conditional events A and B how is the probability of A calculated using the law of total probability?

How is Bayes rule for two events calculated using the law of total probability for A?

What is often used to calculate the denominator in Bayes Rule?
The law of total probability.
What does the law of total probability do?
It relates the unconditional probability of an event A with its conditional probabilities
When is law of total probability used?
when it is easier to compute conditional probabilities of A given additional information.

A random variable X is a function of what?
It is the function of an outcome σ of an experiment, X = f(σ), in other words it is a variable that depends on chance. We can not know what X is until an experiment has an outcome.
What is the domain of a random variable.
The sample space is its domain.
What is the range of a random variable?
It an be the set of all real number or any subset of the real numbers, only dependent on what values a random variable can take.
When working with a random variable X, what do we chart?
We chart all of the possible values x, and their corresponding probabilities.
What is known as the distribution of X?
The collection of all probabilities related to X.
What is the set of all possible values of X called?
The support of the distribution.
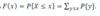
What is the cumulative distribution function?
What is the probability mass function of a value x?
What are discrete random variables?
variables whose range is finite or countable.
What A is an inteval from a to b, how can its probability be computed directly from the cumulative distributive property?


What is the set
exhaustive and mutually exclusive events for different pairs (x, y).
What is the addition rule for when using two random variables?

When are two random variables independent?

What are continuous random variables?
variables whose range assume a whole interval of values. This could be a bounded interval (a, b), or an unbounded interval .
Expected value is denoted with what?

What is the general formula for the expectation?


What is an example of a continous random variable?
A long jump is formally a continuous random variable because an athlete can jump any distance within some range.
How is the variance of a random variable calculated?

When does the variance equal zero?

What is the expectation of a random variable?
its mean, the average value

How is the correlation coefficient calculated?


What is Chebyshev’s inequality?
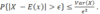
Suppose the number of error in a new software has Exp(X) = 20, and the standard deviation of 2, the probability of the software having more than 30 errors is

If X and Y are integers what can their expectations be?
Any real number.
What does expectation show?
where the average value of a random variable is located, or where the variable is expected to be, plus or minus some error.
How is the variability of a random variable’s value measured?
Measured by its distance from the Expectation.
How is standard deviaton denoted?
σ
How is standard deviation calculated?
It is the square root, +/-, of the Variance.
What is covariance?
summarizes interrelation of two random variables.
What does it mean if Cov(X, Y) = 0?
There is no correlation between the two variables.
What does the correlation coefficient do?
tells how strongly two variables are correlated, values near 1 indicate strong positive correlation, values near -1 show strong negative correlation, and values near 0 show weak correlation or no correlation.
For independent X and Y, Cov(X, Y) equals what?
It equals zero.
The probability of at least 2 is the compliment of what?
1 or less, at most 1
What is the probability of Event 1 and Event 2 when Event 2 is a member of Event 1
The probability is the probability of Event 2
What is a Bernoullie variable?
A random variable that can only take on two possible values, 0 and 1.
What is a Bernoulli trial?
An experiment with a binary outcome.
What are some examples of Bernoulli trials?
- Pass or fail tests
- Heads, or tails
- Boys or girls
What are the two generic names used for the outcomes of Bernoulli trials?
Successes and Failures; however successes do not have to be good and failures do not have to be bad.
In a Bernoulli distribution, if P(1) = p, what is P(0)?
1-p
The expectation of a Bernoulli trial is always what?
The proability of a success.
The variability of a Bernoulli variable is always what?
the product of the probabilities of succes and failure.
The number of Bernoulli trials needed to get the first success has what kind of distribution?
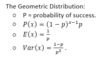
It has geometric distribution
What is an example of an experiment with geometric distribution?
A search engine goes through a list of sites looking for a given key phrase, and terminates as soon as the key phrase is found. The number of sites visited is geometric.
Geometric Random Variables can take what?
Any integer value from one to infinity
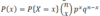
What is the probability mass function for a geometric distribution?

How is the probability of a Binomial distribution described?
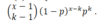
How many success in n trials.
What kind of Variable has Binomial distribution?
A variable described as the number of successes in a sequence of independent Bernoulli trials.
What is the PMF of a Binomial distribution?
What do works like least and most usually mean?
They usually mean that the CDF should be sought for.
What table has the CDF of Binomial Distrubutions?
Table A2
What is the expectation of a binomial distribution?
np, where n is the number of trials.
What is the variance of a Binomial distribution?
npq, where q is 1-p
What is the geometric distribution?
What has negative binomial distribution
the number of trials needed to obtain k successes
What are Poissonian events?
events that are extremely unlikely to occur simultaneously or within a very short period of time.
Binomial varibles count what?
the number of successes in a fixed number of trials
Negative Binomial variables count what?
the number of trials needed to see a fixed number of successes.
What is the Poisson distibution?

What has Poisson distibution?
The numer of rare events occuring within a fixed period of time
What are examples of Poissonian events?
traffic accidents, arrivals of jobs, telephone calls, virus attacks, floods, and earthquakes.
What table has the values of CDFS of Poissonian distributions?
Table A3
If the period of time changes in a problem using Poisson distribution what needs to be adjusted?
only the frequency to what the average would be over the new time period.
what is the Expectation of a negative binomial distribution?
k/p where k is how many successes
What is the variance of a negative binomial distribution?

How do you calculate the PMF of a negative binomial distribution? part 1

How do you calculate the PMF of a negative binomial distribution? part 2

How do you calculate the PMF of a negative binomial distribution? part 3
What is Poisson Approximation of a Binomial distribution?

For all continuous variables, P(x) = ?
zero.
In both continuous and discrete cases, the CDF is what?
a non-decreasing function that ranges from 0 to 1.
What is different about the CDF with continuous variables from discrete variables?
The CDF is a continuous function, and there are no jumps in the CDF.
With continuous variables, probabilities are what?
Areas under a density curve.
What is the probability density function?
A derivative of the CDF, f(x) = F’(X)
What is the total area under a pdf equal to?
The total area under a pdf is equal to 1.
What are the four families of continuous distributions discussed in this chapter?
Uniform, Exponential, Gamma, and Normal.
When is Uniform distribution used?
In any situation when a value is picked at random from a given interval.
Uniform distribution has constant what?
Density.
What is the density function for uniform distribution?
f(x) = 1/(b-a)
What must be true for use of a Uniform distribution?
|b-a| must be a finite countable number
What does [a, b] represent in uniform distribution?
the domain of the uniform density function.
What is an example of a situation with uniform density?
If a flight is scheduled to arrive at 5pm actually arrives at a Uniformly distributed time between 4:50 and 5:10, then it is equally likely to arrive before five and after five.
What is the uniform property?
the probability is only determined by the length of the interval, not by its location.
How is the variance of a continuous random variable calculated?
\int x^2f(x)dx - E(x)^2
How is the expectation of a continuous variable calculated?
\int xf(x)dx
What is the Uniform Distribution?

What is exponential distribution often used for?
To model time.
What are some examples of exponential distributions?
waiting time, interarrival time, hardware lifetime
When is the time between events exponential?
when the number of events is Poisson
if X is time, measured in minutes, what is lambda?
The frequency, number in a time.
If arrival occurs every half minute what is the expectation?
E(X), so it is .5, we expect to get one every .5 minutes.
If arrivals occur every half a minute what is lambda?
lambda is 1/.5, so 2.
What does it mean that Exponential variables are memoryless?
It means that having waited for t minutes gets “forgotten,” and does not affect the future waiting time.
The time T until the next event is greater than t can be rephrased as what?
Zero events occur by the time t.
What is the exponential distribution?

When does total time have gamma distribution?
When a certain procedure consists of alpha independent steps that each takes exponential amounts of time.
In a process of rare events, what has gamma distribution?
In a process of rare events, with exponential times between any two consecutive events, the time of the ath event has Gamma Distribution.
When does a gamma distribution become exponential?
When a =1.
What is the Gamma Distribution?

How can we significantly simplify gamma probabilities?
By thinking of a Gamma variable as the time between some rare events.
What is the gamma poisson formula?
For a Gamma(a , lambda) variable T can be modeled with Poisson(lambda/t) where P{T>t} P{X < alpha} and P{T<= t} = P{X >= alpha}.
What is normal distribution often found to be good for modeling?
sums, averages, errors, and physical variables like weight, height, and temperature.
What is the CDF of the normal distribution?

How do you normalize a Random variable X to Z?

What is the full formula for Variance of X?
Var(X) = E[(X-E(X)^2)] = E(X^2) - E(X)^2
Var(kX + C) = what?
K^2Var(X)
What is the formula for covariance?
Cov(X,Y) = E[(X-E(X))(Y-E(Y))] = E(XY) - E(X)E(Y)
What is the Variance of the sum of two variables?
Var(X+Y) = Var(X) + Var(Y) + 2Cov(X,Y)
Variance is always expressed in what?
Squared units.
What is the correlation between two variables?
Cov(X,Y)/(std(X)*std(Y))
The correlation between two variables will always lie between what?
-1 and 1
Let X be the percentage change in value of investment A in the course of one year, and let Y be the percentage change in value of investment B. You have 1 dollar. You invest a in A and 1-a in B. What is the return on investment?
Return: aX+(1-a)Y
Let X be the percentage change in value of investment A in the course of one year, and let Y be the percentage change in value of investment B. You have 1 dollar. You invest a in A and 1-a in B. What is the expected return?
Expected Return: aE(X) + (1-a)E(Y)
Let X be the percentage change in value of investment A in the course of one year, and let Y be the percentage change in value of investment B. You have 1 dollar. You invest a in A and 1-a in B. What is the variance in your return on investment?
a^2Var(X) + (1-a)^2Var(Y) + 2a(1-a)Cov(X,Y)
What can a continuous random variable model?
Any analog measurements can be the domain of continuous random variables.
Why can’t we sum all of the probability measures of a continuous random variable?
We can not enumerate all of the possible values a continuous random variable can take, so we have to integrate.
What breaks down for continuous random variables, and what does not?
The PMF breaks down, but the CDF does not.
Let X be a continuous random variable. What is P{X = x}?
0
For continuous random variables, P{ X <= x} is the same as what?
It is the same as strictly less, P{X < x}. This goes for all states a < X and X > a, and a < X < B
What is the powder description of PDF?
PDF is not PMF, it describes only density. If we were to break chalk up into a power and distribute it along a number line of where values that a continuous random variable is more likely to take, the denser areas would be where the likeliest values are located. A PDF curve represents this graphically. The CDF is a measure of the density within that region, as though we were to take the power in that region and measure it, but if we were to only measure the weight of one infinitesimal value, it would be zero.
For a continuous random variable, P{a < X < b} is equal to what?
where f(x) is the pdf.

P{X < b} = ?

What are the two conditions for a function to be a legitimate PDF?

Given f_x(X) = { cx^2 for 0 < x < 1 and zero other wise} Find c.

Given f_x(X) = { 3x^2 for 0 < x < 1 and zero other wise} Find the cdf.
x^3
What is the cdf of f(x)?

When we are modeling continuous random variables, how is the probability density function denoted?

What is the probability outside of the region enclosed by the pdf?
0
P(X > x) = ?
P(X> x) = 1 - P(X < x) = 1-F(x)
Without knowing a random variable’s distribution, what can we do if we know its parameters?
We can use Chebyshev’s inequality.
What parameters must we know to use Chebyshev’s inequality?
The variance(or standard deviation) and the expectation
How do we define the joint cumulative distribution function of two continuous random variables?

How is the joint probability density function of a continuous random variable defined?

How do we obtain the marginal pdf of a continuous random variable from a joint pdf?
We integrate the joint pdf over the random variables we want to eliminate.


Given a joint pdf, how can we find P{{a < X < b} and {a < Y < b}}?


When we are speaking of uniform distribution, what does a larger value of b-a mean?
Larger variance
Derive the Expectation and variance of the uniform distribution.
Do it
What is the pdf of the exponential distribution?

Derive the CDF, Expectation, and Variance of the exponential distribution.
do it
How is the exponential distribution related to the Poisson Process?
The expectation of the exponential distribution is the reciprocal of the expectation of the poisson expectation. The time between Poisson processes is exponentially distributed.
What does lambda represent?
lambda is the average number of events in some time interval.
What does the memoryless property mean?
The past doesn’t matter, only the present. but more formally: where t is our time of arrival.

Derive P{T>t}

What is the only continuous distribution that has the memory less property?
The exponential distribution
If we redefine lambda as the average number of events per Unit time and assume a period of interest as [0, t], what is the average number of events in that period?
t*lambda
Gamma distribution is used to describe what?
times between events of Poisson process ( a process in which events occur continuously and independently at a constant rate).
What is the gamma pdf?

What is the gamma function?

What is the expectation and variance of the Gamma distribution?

What can we learn from the graph of a PDF?
The variance translates to the wideness of the PDF. The more “spread” out the PDF, the more values a random variable can take.
What else is the Normal distribution known as?
the Gaussian distribution
What is the mathematical representation of the probability that a random variable is within the neighborhood of 2 standard deviations?

Besides 1-F(t), how can P{T>t} be calculated for Exponential modeling?

What does the Poisson formula really mean at its heart?
It means that if less than this many events happens in this interval of time, then T > t for the gamma random variable.
When are two continuous random variables independent?
If and only if their joint PDF and/or CDF can be factored into two individual pdf’s one of x and one of y, and the conditions on x and y remain the same.
What does it mean mathematically if X and y are independent continuous random variables?
E(XY) - E(X)E(Y) = 0, or E(XY) =E(X)E(Y)
How do we find the expectation of a continuous random variable?

How do we find the variance of a continuous random variable?

How do we find the covariance of a continuous random variable?


What is a stochastic process?
A random variable that also depends on time.
A stochastic process is a function of what?
Two arguments X(t,w) time and the result. w exists in the sample space and is an outcome of an experiment
What are values of X(t, w) called?
These are states
What do we get if we fix a time of a Stochastic Process?
We get the function of an outcome: Xt(w)
What is a realization or trajectory of a sample process?
It is a fixed outcome where we obtain a function of time Xw(t)
When is a stochastic process discrete-state?
When Xt(w) is discrete for each time t
When is stochastic process continuous state?
When Xt(w) is continuous for each time t.
When is a stochastic process a discrete-time process?
When the set of times T, are discrete, that is consists of separate, isolated points.
The CPU usage process in percent is what kind of stochastic process?
A continuous time, continuous state process.
The temperature reported every hour and rounded to the nearest integer is what kind of process?
A discrete time, discrete state process.
When is a stochastic process a continuous time process?
When T is a connected and possibly unbounded interval.
If a stochastic process is markov, the conditional distribution of X(t) is the same under what two conditions?
- given observations of the process X at several moments in the past. 2. given only the latest observation of X.
If a process is markov P{future |past, present} = ?
P{future|present}
What is a Markov chain?
A discrete-time, discrete state Markov stochastic process.
When is a Markov chain homogeneous?
When all its transition probabilities are independent of t. Being homogeneous means that transition from i to j has the same probability at any time.
What does the Markov property mean?
It means that on the value of X(t) matters for predicting X(t+1)

It is the probability of moving from state i to state j by means of h transitions.
What is an h-step transition probability?
It is the probability of moving from state i to state j by means of h transitions.
The distribution of a Markov chain is completely determined by what?
The initial state X(0) and one-step transition probabilities.
What is our long term forecast?
The limit of our h-step transition probability.
In some town, each day is either sunny or rainy. A sunny day is followed by another sunny day with probability 0.7, whereas a rainy day is followed by a sunny day with probability .4, what is the transition probability?
p11 = .7, p12= .3, p21 = .4, p22 = .6
All one-step transition probabilities can be conveniently written as what?
An nXn matrix
What do the rows represent in a transition probability matrix?
The from state
What do the columns represent in a transition probability matrix?
The to state.
What in a one-step transition probability matrix sums to 1?
Each row, but this is generally not true for the column totals.
How do we fin the h-step transition probability matrix?
We raise the matrix P to the h power
A computer is shared by 2 users who send tasks to a computer remotely and work independently. At any minute, any connected user may disconnect with probability 0.5, and any disconnected user may connect with a new task with probability 0.2. Let X(t) be the number of concurrent users at a time t. What are the states of the Markov chain?
0, 1, 2
A computer is shared by 2 users who send tasks to a computer remotely and work independently. At any minute, any connected user may disconnect with probability 0.5, and any disconnected user may connect with a new task with probability 0.2. Let X(t) be the number of concurrent users at a time t. What is the transition probability matrix ?

If the following is the 2step transition probability matrix, what is the probability the system will go from 2 users to 0 users after 2 units of time?

0.4225
If we have n independent variables X with the same expectation and standard deviation, what can we use to predict their sum?
The central Limit Theorem
If we have n independent variables X with the same expectation and standard deviation, what is the standardized sum X+X+X+X?


What are the conditions for using the central Limit theorem?
It applies to any random variables of virtually any thinkable distribution so long as they have the same finite expectation and variance, and as long as n is large > 30.
When a large number of random variables that are independent and have the same expectation and standard deviation, the sum of those random variables create what?
A new random variable with Normal distribution.
What kind of curve is the normal density curve?
A bell shaped curve, symmetric, and centered around the expectation.
What does normalizing a random variable have the effect of?
Taking the bell curve and placing its expectation around zero and giving it a standard deviation of 1.
The spread of the normal density curve is controlled by what?
The standard deviation.
What does Z represent?
A standard normal random variable.
What is the standard normal distribution?
It is a normal distribution with the expectation = 0, and std = 1.
A disk has free space of 330 megabytes. Is it likely to be sufficient for 300 independent images, if each image has expected size of 1 megabyte with a standard deviation of .5 megabytes?
Each image is a random variable with its own expectation and standard deviation, so we use the central limit theorem.

What is the formula for Normal approximation to Binomial Distribution?

What is the continuity correction, when is it used?
It is used when we approximate a discrete distribution with a continuous distribution. P(x) = P{X = x} = P{x-0.5 < X < x+0.5}
How do we obtain a standard normal variable from a nonstandard normal variables?

How does changing the expectation to a normal distribution affect its density curve?
Changing the expectation shifts the curve to the right or to the left.
How can we unstandardize Z?

How is table A4 read?
The rows represent the first two digits of Z and the column represents the third digit of Z
What is the probability density function of a Cauchy random variable?

A cauchy random variable does not have what?
An expectation.
What is the Cauchy distribution CDF?

When a distribution is know known, what can Chebyshev’s inequality give us?
A bound
modelling experiments as random variables describes what?
A single outcome of the experiment.
A random process is a function that assigns what to what?
A time function to every outcome of a random experiment.
We have a stochastic process if the outcome of an experiment results in what?
A function of time.
What is Chebyshev’s inequality?

If the outcomes of a stochastic process are continuous, but the Times are discrete, we have what?
A continuous random sequence.
If the outcomes of a stochastic process are discrete and the time is continuous, what kind of process do we have?
A discrete random process.
When do we have a continuous random process?
When we have a stochastic process in which the outcomes are continuous and so is the time.
What does the autocorrelation of a stochastic process tell us?
It tells us how correlated an outcome at t2 is dependent on an outcome at t1.
How can a distribution of states be represeted?
As a 1x n matrix or a row vector.
How do we find the distribution of states after h transitions using matrix algebra?
Ph = P0P^h, P0 represents the distribution at X = 0, it can be a state distribution (0, 0, 1) or a distribution of probabilities (1/3, 1/3, 1/3). After matrix multiplication, we end up with a vector that represents our final distribution.
What is a steady-state distribution?
A collection of limiting probabilities.
A fast system will go through a very large number of transitions very quickly, its distribution of state is what?
A steady state distribution.
What is the steady state formula?
piP = pi
All pie in the steady state distribution must add to what?
They must add to 1.
The steady state distribution is the solution to what?
The system piP = pi, and the sum of all pi = 1
What kind of markov chains have steady state distribution?
Regular markov chains
What are regular markov chains?
Chains where transitoin p^h > 0, that is there are only nonzero entries in the matrix after many transitions.
When there is a state i with pii = 1, the markove chain cannot be what?
It can not be a regular markov chain. This is called an absorbing state.
What is a limiting matrix?
A limiting matrix is the transition matrix that is created by P^h as h goes to infinity.
What does the limiting matrix look like?
It is a matrix where all rows are identical.
What is the notation for a population parameter and its estimator?

What do we need to know to solve uncertainties?
we need to know the problems distribution and its parameters.
What must we do to gain sufficient information about the parameters of an observed system?
collect data
What do we use to make statements about a very large set?
We use collected and observed samples
what is the population?
the set that consists of all units of interest.
What is a sample?
a set of observed units from the population.
What is a statistic?
any function of a sample. i.e. an arithmetic mean.
Although it happens with a low probability, a sample may sometimes give misleading information, a probability of which is?
Binomial
Sampling and non-sampling errors refer to what?
any discrepancy between a collected sample and a whole population.
The cause of sampling errors is?
the mere fact that only a portion of the population is observed.
What causes non-sampling errors?
inappropriate sampling schemes or wrong statistical techniques.
Three examples of wrong sampling techniques?
○ Sampling from a wrong population.
○ Dependent observations- people surveyed together may have opinions dependent on each other.
○ Sampled specimen not being equally likely to be selected.
What is simple random sampling?
a sampling design where units are collected from the entire population independently of each other, all being equally likely to be sampled.
What is an i.i.d?
independent identically distributed random variables
We consider a sample to be what?
a set of random variables obtained by observation.
Observations collected by means of simple random sampling design are what?
Independent identically distributed random variables.
What are simple descriptive statistics?
measuring the location, spread, variability and other characteristics that can be computed immediately from a collected sample.
What is the mean?
measuring the average value of a sample.
What is the median?
Measuring the central value of a sample.
What do quantiles and quartiles show?
Where certain portions of a sample are located.
Each statistic of a sample estimates what?
The corresponding population parameter.
What does the sample mean estimate?
How is the sample mean denoted?
What is the definition of sample mean?

What is expected to converge to E(X) as a sample approaches a larger and larger size?
The sample mean.
What are the three properties of the sample mean?
- unbiasedness
- consistency
- asymptotic normality
What is a disadvantage to sample mean?
its sensitivity to extreme observations.
What is asymptotic normality?
the distribution of the normalized estimator converges to standard normal distribution as n approaches infinity.
What is consistency, rigorously?

What does unbiasedness mean?
Unbiasedness means that in a long run, collecting a large number of samples and computing the estimator, on the average we hit the population parameter exactly.
What is the rigorous definition of unbiasedness?

This is much less sensitive to extreme observations than sample mean.
the median
Three Definitions of median, sample median, and population median

What are the three skewedness of a sample?
Symmetric: Median = arithmetic mean
Right-skewed: median < mean
Left-skewed: median > mean
How do we find the median of a continuous distribution?
We solve F(x) = .5
How do we find the median of a discrete distribution?
- For a discrete distribution F(x) = .5 has either a whole interval of roots, in which case any number in this interval excluding the ends is a median, or no roots at all.
- If there are no roots at all, the smallest x with F(x) >= .5 is the median.
- It is the value of x where the CD jumps over .5
How do you find the median of a sample?

How can you measure the median speed of cars?
Drive so that half of cars overtake you, and half are overtaken
the construction of these tell us how well we can expect our sample parameter to match the population parameter
Construction of confidence intervals.
What is a p-quantile?
where p is a percentage

Notation for population p-quantile, gamma quantile, quartiles, and medians, and their estimators

The first, second, and third quartiles are the
25th, 50th, and 75th percentiles. They split a population into four equal parts.
what is a gamma perentile?
- A gamma-percentile is (0.01gamma) quantile.
A median is at the same time what?
0.5-quantiles, 50th percentile, and 2nd quartile
Notation of how gamma percentiles, quantiles, quartiles and the median relate.

With a sample of 30, how do we find the .25 quantile?
- For p = 0.25, we find that 25% of our sample of n=30, is np or 0.25*30 = 7.5. For n(1-p) = .75*30 = 22.5. From a sample of 30, we will see that th 8th element has no more than 7.5 observations to the left and no more than 22.5 observations to the right, there fore the 8th element in a sample of 30 is The estimator of Quartile 1.
What is sample variance?

Sample standard deviation measures variability in
The same units as x, Variance is in units squared
What is standard error?
The standard deviation of an estimator
Standard errors show
precision and reliability of estimators.
- They show how much estimators of the same parameter can vary if they are computed from different samples.
These three estimators are sensitive to outliers, or extreme observations.
Sample mean, variance, and standard deviation
This is a measure of variability that is not very sensitive to outliers
The interquartile range
What is the rule for identifying outliers?

What should we do before we do anything with data?
We must look at it
IQR = ?
IQR = Q3-Q1
Six things a quick look at a data graph can suggest
- a probability model, i.e., a family of distributions to be used.
- Suitable statistical methods for the given data.
- Presence or absence of outliers.
- Presence or absence of heterogeneity.
- Existence of time trends and other patterns.
- Relation between two or several variables.
5 ways to visualize data
- Histograms
- Stem-and-leaf plots
- Boxplots
- Time plots
- Scatter plots
We use hypothesis testing to
confirm or reject a statement about a sample population
What is the kth population moment?
E(Xk)
What is the formula for the sample (X1, X2…Xn) kth moment?

What is the first sample moment?
The arithmetic mean xbar
What are central moments?
Central moments are moments which are computed after the data is centralized by subtracting the mean.
For k ≥ 2, what is the kth population central moment?

the expected value is equal to what?
The area above the cdf curve
How do we calculate the expected value using only a CDF?

CDF can find the first moment, but the second moment is found with what?
The pmf
When are methods of moments used?
Under the strong assumption that we know the distribution of our population.
How can we find n parameters if we know the distribution of a sample?
We take n moments of our sample, and n moments of our distribution and form a system of n equations.
When using the method of maximum likelihood, what are we looking for?
Assuming we know the distribution, we are trying to find the parameters that would make that sample most likely to be chosen.
Method of Maximum likelihood is formally what?
maximizing the joint probability of each variable in a given sample according to the distribution. Because they are independent, in the discrete case this is P(x1)*P(x2)…*P(xn)
To find the parameters that make the sample the most likely we find where
the derivative d/dxP(x) = 0, does not exist, or the boundaries of the sample parameter.
How do we simplify maximizing the joint probability of a sample?
By using the formula

Simplify and use maximum likelihood to find the lambda of a sample that is of poisson distribution

What are the two methods for estimating parameters of a population?
Method of Moments Method of Maximum Likelihood
How is the kth population moment defined as?

What is the kth sample moment defined as?

What is the first sample moment?
The sample mean.
What is centralizing the data?
Subtracting the mean from each element.
What is the kth population central moment defined as?

What is the second population central moment?
Var(X)
What is the second sample central moment?
The variance, with n replace by n-1
How is the k-th sample central moment defined?

What is the method of maximum likelihood?
○ We find such parameters that maximize the probability of getting our data sample.
For a discrete distribution, which formula do we maximize?
The joint PMF of iid
For a continuous distribution, what formula do we maximize to find the data’s parameters?
For a continuous distribution, we maximize the joint density.
What is a computational shortcut for using the method of maximum likeliness?
A nice computational shortcut is to take logarithms first

Take the logarithm of the Poisson distribution joint pmf, and maximize it to find the parameter lambda.

What do standard errors measure?
Standard Errors serve as the measures of our estimators accuracy.
How is the standard error of our estimated expectation calculated?

Use the method of maximum likelihood on the exponential density to find Lambda, and use the logarithm shortcut.

Sometimes the likelihood has no critical points inside its domain, then
it is maximized at its boundaries.
What is a parameter?
A numerical fact about a population.
What are all numerical facts about a sample called?
Statistics
What does lambda hat represent?
The rate in a sample.
Describe a simple random sample?
The sample is drawn from a population randomly, like tickets from a box. Each is drawn without replacement.
The size of our sample must not affect what?
The distribution of the population, in other words, it must not be so large the distribution of the box no longer holds.
What is the expectation and variance of p hat, and the standard error of phat in a binomially distributed sample?
E(P) = phat, Var(phat) = p(1-p), SE = sqrt((p*(1-p))/n)
What is the standard Error of an estimator?
std(estimator)/sqrt(n)
SUM Var(Xi) = ?
Var Estimator/n
What do we need to know to calculate the standard error of a sample?
The standard deviation of the population as a whole.
What is simple bootstrapping?
We decide the sample standard deviation can be used as the population standard deviation.
What is the standard error?
The standard error is the standard deviation of the expectation.
What does unbiased mean?
It means that the estimator does not tend to skew to the left or right
What is a biased estimator of the Standard deviation of the population, and how do we fix this?
The standard deviation of a sample. We divide the Variance of the sample by n-1 instead of n.
We are using the standard deviation of a sample as a standard deviation of the population, how do we calculate this?
SUM(Xi-X\bar)^2/n-1
What is a confidence interval?
The range within which the true value resides with some confidence level.
When is the confidence interval the narrowest?
As n goes to infinity
What does a 90% confidence interval mean?
It means that if a sampling process was done many times, 90% of the intervals produced would capture the true parameter.
Confidence level is not what?
The probability that the actual value of the parameter is within the confidence interval.
This is often referred to as the confidence level.
The coverage probability (1-\alpha).
How do we calculate the confidence level using the normal distribution?
b = Estimator - Z_alpha/2*Sigma(Estimator)
What is the margin of error = ?
sigma*Z_alpha/2
If we want a confidence interval of 90%, what is alpha and the critical z score?
alpha = .1 critical Z score = +/- 1.645
Derive the Var(X\bar), and SE or SD(X\bar)

This is sometimes called the critical probability:
1-(alpha/2)
When can we use the standard deviation of a sample as the standard deviation of a population?
When the sample size is sufficiently large.
When must we use to the t distribution?
When a sample is normal, but small.
We have a small sample from a normally distributed population, C.I. for the mean = ?
X\bar +/- (t_alpha/2)*s/sqrt(n) where s is the standard deviation of the sample.
What is the degree of freedom?
d.f. = v = n-1
How do we find t_alpha?
T_alpha the anazlog of Z distribution.
What happens when the degree of freedom goes to infinity?
We get a normal distribution.
What is it that we can and cannot tell about a hypothesis?
We cannot tell if a hypothesis is true or not; all we can do is determine whether the data provides sufficient evidence against the null hypothesis in favor of the alternative hypothesis.
How is the null hypothesis denoted?
H_0
How is the alternative hypothesis denoted?
H_a
What is a null hypothesis involving the mean of a population?
H_0: our sample mean equals the population mean.
What are the three types of alternatives?
- Two sided alternative: H_a mu does not equal mu. 2. one-sided, left tail H_a: mu is left then sample mu. 3. one-sided, right tail H_a: mu is more than sample mu.
Sampling error occurs when we do this:
wrongly accept or reject our null hypothesis
What does low level of significance mean?
it means that only a large amount of evidence can result in rejection of our null hypothesis.
What is a type one error?
When the result of our test tells us to reject our null hypothesis, although it is true.
What is a type II error?
When our test tells us to accept our null hypothesis, though it is false?
Which type error in hypothesis testing is considered worse?
A type II error.
What makes a good test result in erroneous decision?
Extreme observed data
What is the significance level of a test?
The probability that the test tells us to reject our null hypothesis wrongly.
