Quantitative Methods: Basic Concepts Flashcards
TVM: Interpreting Interest Rates (3)
- Equilibrium interest rates are required rate of return for a particular investment
- Interest rates also known as discount rates
- Interest rates are the opportunity cost of current consumption because future consumption could be i% higher
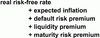
TVM: Components of Interest Rates
Required (nominal) interest rate on a security=
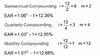
TVM: Effective Annual Rates - Examples (3)
Stated Annual Rate is 12%
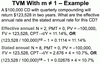
TVM: TVM - Example (2)
TVM: PV of a Perpetuity - Example
Preferred stock pays $8/year forever, with 10% rate of return. What is it’s present value?

TVM: FV of Single Sum
FV of $200 invested for 2 years at 10% interest rate

TVM: PV of a Single Sum - Example
PV of $200 in 2 years at 10% interest

TVM: PV of an Ordinary Annuity
PV of $200, received each year, for 3 years, at 10% interest rate

FV of an Ordinary Annuity
What is the value in three years of $200 to be received at the end of each year for three years when interest rate is 10%

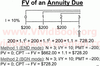
TVM: PV of Annuity Due
PV of $200 received at the start of each year, for 3 years at 10%

TVM: FV of Annuity Due
FV of $200 received at beginning of each year for 3 years at 10% interest
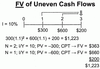
TVM: FV of Uneven Cash Flows
PV of $300 received 1st year, $600 received 2nd year, and $200 received 3rd year at 10% interest
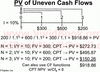
TVM: PV of Uneven Cash Flows
PV of $300 received 1st year, $600 received 2nd year, and $200 received 3rd year at 10% interest
TVM: Mortgage Example
- Month Payment on $100K, 30-year home loan at 6% stated rate N=30y x 12m = 360 payments, I = 6%/ 12m= .5 I/Y
PV= 100,000; FV = 0; CPT –>PMT = -599.55
- Remaining principle after 85 payments
N = 360 - 85 = 275 payments left CPT –> PV = 89,488
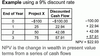
DCF: NPV
Net present value: the sum of present values of a series of cash flows
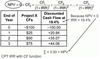
DCF: IRR
- Internal rate of return: IRR is the discount rate that equates the PV of a series of cash flows to their cost
- The IRR is the discount rate that makes NPV = 0
- Possible Problems with IRR:
- When a series of cash flows goes from negative to positive, then back to negative again, there can be more than one IRR
- Series of csh flows can be ranked by their NPVs, but IRR rankings can differ
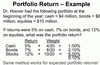
DCF: Holding Period Return: Example

DCF: Time-Weighted Returns
Annual time-weighted returns are effective annual compound returns

DCF: Money-Weighted Returns
- Money-weighted returns are like an IRR measure
- Periods must be equal length, use shortest period with no significant cash flows

DCF: BDY, HPY, EAY, MMY

DCF: Yield Example
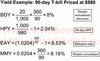
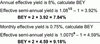
DCF: BEY
Bond Equivalent Yield is 2x the effective semi-annual yield
Statistics: Basic Terms (7)
- Descriptive Statistics- describes properties of a large data set
- Inferential Statistics- use a sample from a population to make probabilistic statements about the characteristics of population
- Population- a complete set of outcomes
- Sample- a subset of outcomes drawn from a population
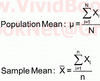
- Parameter- describes a characteristic of a population
- Sample Statistic- describes a characteristic of a sample (drawn from a population
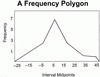
- Frequency Distribution- a table that summarizes a large data set by assigning the observations to intervals
Statistics: Measurement Scales (NOIR) (4)
- Nominal- Only names make sense (eg. Parrot, robin, seagull)
- Ordinal- Order makes sense (eg. large-cap, mid-cap, small-cap)
- Interval- Intervals make sense (eg. 40F is 10* greater than 30F)
- Ratio- Ratios make sense (abs zero) (eg. 200 is 2x as $100)