Probability and Distributions Flashcards
How do you find the mean?
Add up all the data points and divide by how many there are.
How do you find the mode?
The most common data point is the mode (there can be multiple).
How do you find the range?
Largest value from the data set minus the smallest.
How do you find the median?
Put the data set in numerical order. Cross out each number from either end of the data set until you get to the middle of it. If the number of data points is even, you may need to add the middle two numbers and divide by two.
How do you find standard deviation?
Obtain the sum of every squared data point. Minus this result from (the mean2 multiplied by n) and divide by n -1. Then take the square root.
How do you find inter-quartile range?
For the upper quartile range the formula is: 3/4 (n+1) which gives the nth term to consider. If the number of data points is even, you need to consider taking the two data points either side and divide by two. Same with lower quartile with the formula: 1/4 (n+1). Note that even if the nth term can round down you always round up. The interquartile range is the difference between the two.
How do you find the coefficient of variation?
The standard deviation of the data set divided by its mean.
How do you find the standard error?
The standard deviation of the data set divided by the squared root of how many data points there are.
What does the phrase ‘mutually exclusive’ mean?
Conceptually it is like a coin toss. The probability of A does not affect the probability of B, thus P(A and B) = 0.
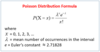
How do you identify and use a Poisson distribution?
Start with X~Po (n×P). The Poisson distribution requires a small p value (p≤0.1) and a large n value (n≥50). The greek symbol lambda is equal to n multiplied by p (this is the mean which is equal to the variance).
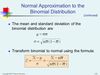
How do you use the normal distribution approximation?
Start by labelling correctly X~N (mean, varience). X is then the value you are working with to approximate probability towards. Sigma is the standard deviation. The value you obtain (Z) can be found in the standard normal function table. If the Z value is set to be greater than a positive value or smaller than a negative value, use the value from the table and subtract it from 1 to get the true value. If Z is between two values, always take the value of the right and minus it with (1 - value of the left).
What is a binomial distribution?
Data that has a set number of trials (n) and has two possible outcomes (i.e: heads or tails). The trials are independent and the probability for one event or the other remains constant.
What is a continuous and discrete random variable?
A discrete random variable is one which may take on only a countable number of distinct values such as 0,1,2,3,4. An example would be the number of defective lightbulbs in a box of ten. A continuous random variable is one which takes an infinite number of possible values. Continuous random variables are usually measurements. Examples include height, weight, etc.
How do you work out the expected value?
For a random variable the expected value is the sum of all probabilities each multiplied by their value. For example, for a six sided dice it would be 1/6 + 2/6 + 3/6 +…6/6 = 3.5. For a binomial distribution the expected value is n multiplied by p.
How do you work out the variance?
For a random variable you take the sum of each probability each multipled by the square of their values and then minus the square of the expected value from it. For a six sided dice: (1/6 + 4/6 + 16/6…) - (3.52). For a binomial distribution you multiply (1-p) by np.
