Paper 2 Required practicals Flashcards
Elasticy PAG - Describe a suitable method

Hang a spring off a clamp stand
Measure the original length of the spring
Add a 1 N weigth and measure the final length of the spring with a ruler
Calcualte the extension (final length - original length)
Repeat for weights 2, 3, 4, 5 and 6 N
Elasticy PAG - State the variables and whether they are continuous, discrete or catergoric

Independent - Weight (continuous)
Dependent - Extension (continuous)
Control - Spring constant (continuous)
Elasticy PAG - What type of graph should you draw? Why?

Line - both variables are continuous
Elasticy PAG - Describe the expected results

Forces is directly proportional to extension as long as the elastic limit hasnt been passed.
The graph should be a straight line through the origin up to the elastic limit.
Elasticy PAG - What is the main cause of error and how can it be reduced?

Parallax error not having your eye level with the spring when measuring its extension.
Reduce this my placing a wooden splint horizontally at the bottom of the spring.
Elasticy PAG - Describe a suitable risk assessment

Clamp stand may topple - this could fall and hurt your foot - place a counter weigth on the base of the clamp to stop it toppling
Elasticy PAG - Describe elastically deformed

The object will return to its original length when all forces are removed
Elasticy PAG - Describe inelastically deformed

An object wont return its original length once all forces are removed, it has been permanently stretched.
Elasticy PAG - State Hooke’s law equation

Force (N) = Spring constant (N/m) x extension (m)
Elasticy PAG - how can the spring constant be found from a graph of force against extension

From the gradient
Newton’s second law PAG - state the relevant equation

Resultant Force (N) = mass (kg) x acceleration (m/s2)
Newton’s second law PAG - Describe a suitable method

Attached a piece of card of known length to a trolley.
Attached some string to the trolley running over a pulley.
Place a 1 N weigth on the end of the string and allow it to accelerate the trolley through two light gates.
Use the light gates to measure the acceleration of the trolley
Repeat for 2, 3, 4, 5 and 6 N
Newton’s second law PAG - State the variables and whether they are continuous, discrete or catergoric

Independent - Resultant force (continuous)
Dependent - Acceleration (continuous)
Control - mass of trolley (continuous), Material of surface (discrete)
Newton’s second law PAG - State the expected results

As resultant force increases the acceleration will increase. They are directly proportional to each other so the graph should be a straight line through the origin.

Newton’s second law PAG - Describe a risk assessment

Falling masses - could land on your feet - stand away from the experiment
Newton’s second law PAG - If the resultant force was kept constant but the mass of the trolley was increased what results would you expect?

As mass of the trolley increases the acceleration will decrease, they are inversley proportional to each other.
Newton’s second law PAG - What type of graph should you draw? Why?

Line - both variables are continuous
Newton’s second law PAG - How can a light gate measure velocity?

Tell the data loger the length of card (distance)
The light gate will measure the time the card blocks the laser.
Velocity = distance / time
Newton’s second law PAG - How can two light gate measure acceleration?

Light gate 1 measures initial velocity
Light gate 2 measures final velocity
Light gate measure the time between light gates
acceleration = change in velocity / time
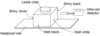
Absorption PAG - Describe a suitable method

Fill the Leslie cube with boiling water,
Measure and record the starting temperature.
Measure and record the final temperature after 10 minutes.
Calcualte the temperature difference.
Absorption PAG - State the variables and whether they are continuous, discrete or catergoric

Independent - Coulour of the surface (catergoric)
Dependent - Temperature change (continuous)
Controls - Starting temperature (continuous), Surface area (continuous)
Absorption PAG - Describe a suitable risk assessment

Boiling water - can burn - place leslie cube in the middle of the desk and stand up
Absorption PAG - What graph should you draw why?

A bar chart as one of the variables is categoric
Absorption PAG - Describe the expected results
Light shiny surfaces are the best reflectors of heat so will have the highest temperature at the end of the experiment
Dull dark surfaces are the best absorbers and emitters of infrared radiation so they will have the lowest temperature at the end of the experiment.


