P2.3.2 - Motion Graphs Flashcards
What is meant by acceleration?
When an object moves faster and faster.
What type of graph is this?

A distance-time graph
Use the distance time graph to calculate the average speed of Lucy over her whole journey?
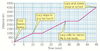
Speed = Distance ÷ Time
Speed = 4000m ÷ 45 minutes (x60 to turn into s)
Speed = 4000m ÷ 2700
Speed = 1.48 m/s

What does the distance-time graph below represent?

An object that is accelerating.
At which 2 points in time did the person stop according to the distance-time graph?

At 10 minutes and 30 minutes.
Whenever the line goes flat the object is staitonary.

The graph shows part of a distance-time graph. Which line represents an object moving at a medium speed?

The red line because its steepness is in the middle.

The graph shows part of a distance-time graph. Which line represents an object moving at the highest speed?

The green line because it is the most steep.

The graph shows part of a distance-time graph. Which line represents an object moving at a slow speed?

The purple line because it is the least steep.

