Naked Statistics - Charles Wheelen Flashcards
What is a major limit of statistics?
Overreliance on any descriptive statistic can lead to misleading conclusions (p6)
What is regression analysis?
A tool that enables researchers to isolate a relationship between two variables while holding constant (or controlling for) the effects of other important variables (p11)
What is the point of statistics?
To learn things that inform our lives (p13)
What are 7 reasons to learn statistics?
- To summarize huge quantities of data 2. To make better decisions 3. To answer important social questions 4. To recognize patterns that can optimize processes 5. To catch cheaters and prosecute criminals 6. To evaluate the effectiveness of policies, programs, drugs, medical procedures, etc. 7. To spot those who use statistical tools for nefarious ends
What is the mean?
The average of a distribution
What is the median?
The point that divides a distribution in half
When will the mean and median be similar?
In distributions without serious outliers.
What is the difference between “absolute” values and “relative” values?
Absolute values can be interpreted without context, e.g., it’s 80 degrees outside. Relative values have meaning only in comparison to something else, e.g., standardized tests.
What is the standard deviation?
A measure of how dispersed the data are from the mean–how “spread out” the observations are. It allows us to assign a single number to the dispersion around the mean.
What does a “standard deviation of 18” mean?
A high proportion of observations are 18 above and 18 below the mean.
What is a normal distribution?
Data that are distributed normally are symmetrical around their mean in a bell shape.
In a normal distribution, what proportion of observations are within one, two, and three standard deviations of the mean?
One standard deviation: 68.2%; two: 95.4%; three: 99.7%
What greek letters represent the mean and standard deviation?
Mu and Sigma
What is the difference between “percentage change” and “change in percentage points?”
Percentage change always gives the value of a figure relative to something else. Example: a sales tax increase from 3 to 5 percent is two percentage points, but a percentage change of 67%.
What is an index?
A descriptive statistic made up of other descriptive statistics, e.g., passer rating, or the S&P 500 index.
What is the formula for the variance and standard deviation?
Variance: for any set of observations x1, x2, x3…xn, with mean m, Variance = s^2 = [(x1-m)}^2 + (x2-m)^2 + (x3-m)^2+…(xn-m)^2)] / n Standard deviation: square root of the above (p34-35)
Why does calculating the variance put particular weight on observations that lie from the mean–the “outliers”?
Because the difference between each term and the mean is squared. (p34)
What does the median versus mean question revolve around?
Whether or not the outliers in a distribution distort what is being described or are instead an important part of the message (p44)
What is correlation?
Correlation measures the degree to which two phenomena are related to one another. (p59)
What is the correlation coefficient?
An association between two variables expressed as a single number ranging from -1 to 1. The closer the correlation is to -1 or 1, the stronger the association (inverse or direct relation).
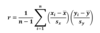
What is the formula for the correlation coefficient?