Medical statistics Key Areas Flashcards
Primary vs Secondary data
Primary Data (Indicative):
- Indication/ impression of reality but difficiult to analyse
- This is Blood. Tissue samples, patient records, histological slide, DNA sequence, fingerprint, cadaver
Secondary Data (Derivative):
- Numbers derived from primary data and easier to analyse
- Peak response, BP/ counts, surface coverage, antibody levels, weight/age, number of deaths
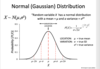
Normal distribution
Why is controllign osurces of variability important in studies
‘Overall’ mean and SD substantially misrepresent the real world. Hence contorlling sources of varibaility is key to good studies so finding out values for both males and females etc.
What is Experimential design about?
- Identifying
- Defining
- Mnaaging
- Quantifying
Source sof variability can be what you introduce, plain random etc or groups.
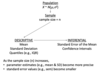
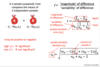
WHat do parameters and error bars tell us?
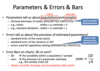
Descriptive and inferential measures of a sample
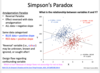
WHta is Simpsons Paradox?
- Analysis must match design
- Design must match hypothesis
- Be suspicious of dichotomisstion (small/large)
Principles of experimential design
- Controlling eg, placebo
- Rnadomising - systemic bias
- blinding -personal bias
- Replication - increase precision (Sample size and statistical power)
Important questions vs Trivial Questions in Hypothesis testing
Important questions - easy to ask, difficult to answer
Trivisal questions - easy to ask, easy to answer
Null VS Alternative hypothesis
Null hypothesis = population parameter is equal to hypothesised value.
. Alterntive hypothesis = You might believe to be truw or hope to prove true
Family- Wise Error Rate (FWER)

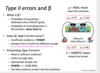
Type II errors
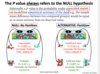
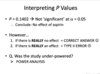
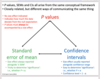
P- value
Informally = Probability under specified statisticla model that a statistical summary of the date (eg sample mena difference between 2 comapred groups) would be equal to or more etreme than its observed value.
- ALWAYS refers to NULL hypothesis
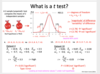
WHat is. t TEST?
When Null hypothesis is true on average t=0
T test and graph
On avergae t is not 0 when null hypothesis is NOT true
Interpreting P values
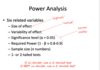
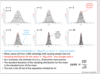
Power Analysis (6 related variables)
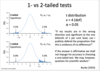
1 vs 2 tailed test
COnfidence intervals VS Credible itnerval
A confidence interval gives an indication of the degree of uncertainty of an estimate, showing the precision of a sample estimate. The 95% confience intervals are calculated so that if we repeated the study many times, 95% of the time the true unknown value would lie between lower and upper ocnfidence limits. A wider interval indicates more uncertainty in the estimate. Overlapping confidence intervals indicate that there may not be true difference between 2 estimates.
Credible interval = gives indication of ucnertainty of an estimate from data anlysis. 95% credible intervals are calculated so that there is 95% probability of the true value lying in the interval.
P vales, CI and standard errors of means (differences etc)
Sampling Distirbution
- Probability distribution of a sample statistic eg, mean
- The standard deviation of the sampling sistirbution is the standard error of the sample statistic for sample size = n
- As n increases, the sampling distribution (and therefore its standard deviation) narrows
- By a miracle of statistics, if is often possible to estimate the SE from a single sample with n data…
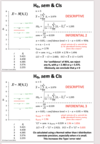
H0, sem and CIs

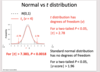
Normal vs t distribtuons
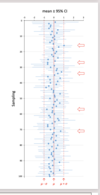
H0, sem and CIs example 2