Information Architecture Flashcards
Benefits of employing an architecture
- Baseline for requirements
- Easy development of new applications
- Reuse architectural assets, products
- Plattform for selecting new products (tools, apps)
- Fewer decisions, hence speed
- Set of architectural standards
- Defines the business context for sustainable BI
- Forces the business to think about the big picture
- Enables analytics across a range of processes
- Avoids premature rush to selecting products
- Restrains the IT function, business power users
The four BI architecture categories
- Each of these categories will have sub layers
- Requirements flow downward
- Implementation flow upwards
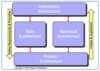
of the four types of architecture, where is BPM used
information architecture
Questions that need answers when designing archictures

define information architecture
the structural design of shared information environments;
the art and science of organizing and labelling websites, intranets, online communities and software to support usability and findability;
Basic Process of Information Architecture
- to gather data from inside and outside the enterprise
- transform it into information that the business uses to operate its business today and to plan for the future.
purpose of modelling
Data modelling is about defining the target data structures.
- standardise the process
- reproduce the process
- increase efficiency
- measure the process
define data integration
- combines data from different data sources
- provides users with a unified view of the data
Examples:
- commercial: two similar companies need to merge their databases
- scientific: combining research results from different bioinformatics repositories
Data integration appears with increasing frequency as the volume and the need to share existing data explodes.
Data Integration Framework Building Blocks
- This is a lot more than an Extract, Transform and Loadtool; ETL tools are only one element in a DIF.
- Beware of magic bullets, panaceas and of people who tell you their latest tool will fix all your DI problems
- As in a lot of Computing, we have the triangle of People, Process and Technology. Architecture and Standards are no less important

Describe Data Integration Frameworks (DIF)
A combination of architecture, processes, standards, people and tools used to transform enterprise data into information for tactical reporting and strategic analysis
Data integration framework (DIF) information architecture
- 6 step process
- it’s purpose
- Take data from systems of record,
- integrate it
- put it in the EDW,
- extract from the EDW
- put into data marts or OLAP cubes
- apply BI and analytics
The objective of the architecture is to gather data from inside and outside the enterprise and transform it into information that the business uses to operate its business today and to plan for the future
Data is gathered, transformed using business rules and technical conversions, stored in databases tobemade available to business users for reporting and analysis

2 stages in Data Integration
- Data Preparation (collect)
- Data Franchising (distribute)
Architecture Components
- Data Preparation
- Data Franchising
- Business Intelligence and Analytics
- Data Management
- Metadata Management
Architecture Component:
Data Preparation (6 steps)
- Gather
- Reformat
- Consolidate
- Transform
- Clean
- Store

Architecture Component:
Data Franchising
- Create information for reporting and analysis with BI tools.
- Data further filtered, reorganised, transformed, summarised and/or aggregated, and stored
- Copied from DW to business area data marts or cubes
Architecture Component:
Business Intelligence and Analytics
Deliver data to business users using BI applications
- Reports, spreadsheets, alerts, graphics, analytic applications
Architecture Component:
Data Management
Processes and standards used to define, govern and manage a company’s enterprise information assets
Architecture Component:
Metadata Management
Processes, procedures and policies that define and manage the metadata used by the DIF
Define a Data Mart
The access layer of the data warehouse environment that is used to get data out to the users.
The data mart is usually oriented to a specific business line or team. Whereas data warehouses have an enterprise-wide depth, the information in data marts usually pertains to a single department or business area.
Data Preparation Step 1: Gather Data
Part of data integration:
-
gather data from various internal and external sources
- usually mix of custom, package, cloud applications
- transform it according to business and technical rules
-
stage it for later steps where it becomes information used by business consumers.
- Staging may not be in permanent physical files in every step of the process.
Data Profiling
Data profiling is about understanding the data in the source system, before going through the data preparation phase.
- Examine the structure, content of data sources
- Perform source system analysis
- Find anomalies, understand data quality
- Feed into design of the data integration workflow
Data Preparation Step 2: Reformat Data
-
Convert the data to a common format and schema
- To be fed into a Data Warehouse
- Straightforward if there are schema, column definitions for the source data
- If not, you may need to discover them (use SME)
- All governed by master data in the Reference or Dimension tables
Database Schemas
- Schema is the structure of the database that defines the objects in the database
- In a relational database, the schema defines:
- database’s tables, fields, relationships, indexes, database links, directories, XML schemas, and other elements.
- Set of integrity constraints imposed on a database
Data Preparation Step 3: Consolidate, Standardise, Validate Data
- Provide a single, consistent definition for business users
- Validate by checking dimensions or reference tables
- To see if it conforms to specific business rules
- Reference files are metadata you build up to describe the eventual Data Warehouse
Data Preparation Step 4: Transform Data (+examples)
- Business transformations turn data into business information
- Apply business rules, algorithms, filters to put data into a business context
- May also associate a business transaction in a dimensional context, such as the region, business divisionor product hierarchy it is associated with
Examples
- Create summary tables
- By week, by month, by year – historical data
- By organisation - branch, area, region, country…
- Apply calculations
- Interest, Net Present Value, averages, etc.
- Data Warehouse holds historical data
- analysis of trends, etc.
Data Preparation Step 5: Cleanse Data
- Goal is to establish data consistency
- Cleansing involves a more sophisticated analysis
- e.g. name and address cleansing, customer householding
- simpler data quality checking has already been done
- Ouput is: good and cleaned records
- IT people often send cleaned data back to source
- Avoids need to clean it again
- Reduces problems with dirty data
- Can buy special purpose data cleansing tools
- Particularly for customer data, e.g. name and address
- John Doe, MrJ Doe, MrJohn Doe
- 12 Main Street, 12 Main St, 12 Main Street, Suite 135
- Easily distinguished visually; harder for ETL tools
- Customer Householding
- Another aspect of data cleansing
- Link family members’ personal and business accounts or purchases
- For customer convenience
- no multiple brochures through post
- For their own convenience in promoting their products
- For customer convenience
- Done by retailers and financial services firms
Data Preparation Step 6: Store Data
- Store transformed, cleansed data in DW
- Make it available for further processing
- Either directly from DW or through data franchising
Data Franchising
Next set of processes after Data Preparation
- Takes data from the Enterprise Data Warehouse
- Transforms it to information used by BI tools
- Stores in data marts, OLAP cubes etc.
- Making convenient for business analysts

Reasons for Data Franchising
- Give them the subset of data relevant to them
- Apply rules, filters, transformations, aggregations that are specific to the business group or process
- Makes the data more understandable to that business group
-
A key point here is that franchising takes from the EDW only the data needed by particular business teams
- So business people can understand the data
- Improves business and IT productivity
- Enables self-service BI (no need of IT dep.)
- Aggregations – may take many records and create aggregates
- In particular, it is a unit for data manipulation and management of consistency
- Many NoSQL databases use an aggregate data model
Data Franchising Step 1: Gather, Filter & Subset data from the DW
- Assumption – data preparation has already happened
- so it’s consistent, conformed, clean, current
- Filter it by rows, columns to get just what you need
- Put it in a staging area – temporary store
Data Franchising Step 2: Restructure or Denormalise Data
* Target schemas will likely be different from source
* Particularly if non-relational databases used * Define source to target mappings
Denormalise means:
- Adding redundant copies of the data
- Or grouping data
- Done for performance reasons
- Designer adds constraints to keep copies in sync
In computing, denormalization is the process of trying to improve the read performance of a database, at the expense of losing some write performance, by adding redundant copies of data or by grouping data. It is often motivated by performance or scalability in relational database software needing to carry out very large numbers of read operations.
Data Franchising Step 3: Transformations and Calculations
Perform business transformation and metrics
- calculations used by the specific business processes whose marts or cubes you are building
Data Franchising Step 4: Aggregate or Summarise
- Certain BI tools may need you to summarize or aggregate
- Usually to improve response time
- Especially with drill-down dashboards
Data Franchising Step 5: Store Data
store data in data mart or OLAP cube
- marts, cubes use persistent storage
- because they’ll be around for a long time
Reference or Dimension tables
Used to control the preparation and franchising
- Referential integrity
- Lookups and cross-maps
- Business transformation
- Business metric calculation
- Query selection criteria
- Aggregations
- Report value bands
list some BI applications
Lots of ways to consume the business intelligence…

Data Management Processes
Processes and standards used to define, govern and manage a company’s enterprise information assets.

Metadata
- Description of the data as it is created, transformed, stored, accessed, consumed
- Essential for data management
Technical Metadata
- Description of the data as it is processed
- Databases: define columns, tables, indexes
Metadata is used by the software tools to understand and process the data:
- ETL tools: fields, source-to-target transformations, workflows
- BI tools: fields, reports
Business Metadata
- Description of the data from business perspective
- e.g. inventory turns, weekly sales, budget variances
- Most of the data relevant to the business is not used by software tools
Operational BI and. Analytical BI
- Analytical BI – business decisions
- Operational BI – operational decisions

Benefits of Operational BI
- Essential for day-to-day running the business
- Capture, monitor, report on business transactions
- Operational BI often comes with business applications
- Real-time data access and alerting of problems
- Dashboards are often used
Data mining
- Process of discovering patterns in large data sets
- Uses combination of AI, machine learning, statistics
- automatic or semi-automatic analysis
- Finds patterns, not data itself
The term “mining” is confusing, because the goal is the extraction of patterns and knowledge from large amounts of data, not the extraction (mining) of data itself.
Data integration workflow

