Graphing Functions Flashcards
(26 cards)
If there is a negative OUTSIDE the parentheses…
f(x) = -x * 2
REFLECT over the x-axis vertically
(all y-values become negative)
If there is a negative INSIDE the parentheses…
f(x) = 1 / (-x + 3)
REFLECT over the y-axis horizontally
(all x-values become negative)
If there is a number being ADDED OUTSIDE the parentheses…
f(x) = 2x + 2
SHIFT/TRANSLATE up vertically by that amount
(all y-values increase at the end)
If there is a number being SUBTRACTED OUTSIDE the parentheses…
f(x) = 2x - 2
SHIFT/TRANSLATE down vertically by that amount
(all y-values decrease at the end)
If there is a number being ADDED INSIDE the parentheses…
f(X) = 3 * (x + 2)
SHIFT/TRANSLATE left horizontally by that amount
(all x-values decrease)
*opposite what you expect
If there is a number being SUBTRACTED INSIDE the parentheses…
f(X) = 3 * (x - 2)
SHIFT/TRANSLATE right horizontally by that amount
(all x-values increase)
*opposite what you expect
If there is a WHOLE number coefficient OUTSIDE the parentheses…
f(x) = 4 * (x + 2)
or
f(x) = 4 * x
STRETCH the graph vertically by that amount
(multiply the y-values of all the points by that coefficient)
If there is a FRACTIONAL number coefficient OUTSIDE the parentheses…
f(x) = 1/4 * (x + 2)
or
f(x) = 1/4 * x
COMPRESS the graph vertically by that amount
(multiply the y-values of all the points by that coefficient)
If there is a WHOLE number coefficient INSIDE the parentheses…
f(x) = (4x + 2)
STRETCH the graph horizontally by that amount
(multiply all x-values by the inverse of that coefficient)
*opposite what you would expect
If there is a FRACTIONAL number coefficient INSIDE the parentheses…
f(x) = (1/4x + 2)
COMPRESS the graph horizontally by that amount
(multiply all x-values by the inverse of that coefficient)
*opposite what you would expect
SUMMARY:
Inside Parentheses = _______ changes
and = flips over ___-axis
Inside Parentheses = horizontal changes
and = flips over y-axis
*counterintuitive one
SUMMARY: Outside Parentheses = _______ changes
and = flips over ___-axis
Outside Parentheses = vertical changes
and = flips over x-axis
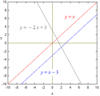
Linear Function
y = mx + b
Where m and b are constants. A typical use for linear functions is converting from one quantity or set of units to another. Graphs of these functions are straight lines. m is the slope and b is the y intercept. If m is positive then the line rises to the right and if m is negative then the line falls to the right.
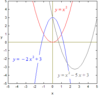
Quadratic Functions
y = ax2 + bx + c
where a, b and c are constants. Their graphs are called parabolas. This is the next simplest type of function after the linear function. Falling objects move along parabolic paths. If a is a positive number then the parabola opens upward and if a is a negative number then the parabola opens downward
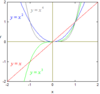
Power Functions
y =axb
where a and b are constants. They get their name from the fact that the variable x is raised to some power. Many physical laws (e.g. the gravitational force as a function of distance between two objects, or the bending of a beam as a function of the load on it) are in the form of power functions. We will assume that a = 1 and look at several cases for b.
The power b is a positive integer. See the graph to the right. When x = 0 these functions are all zero. When x is big and positive they are all big and positive. When x is big and negative then the ones with even powers are big and positive while the ones with odd powers are big and negative.
The power b is a negative integer. See the graph to the right. When x = 0 these functions suffer a division by zero and therefore are all infinite. When x is big and positive they are small and positive. When x is big and negative then the ones with even powers are small and positive while the ones with odd powers are small and negative.
The power b is a fraction between 0 and 1. See the graph to the right. When x = 0 these functions are all zero. The curves are vertical at the origin and as x increases they increase but curve toward the x axis.
Polynomial Function
y = an · x n + an−1 · x n−1 + … + a2 · x 2 + a1 · x1 + a0
where an, an −1, … , a2, a1, a0 are constants. Only whole number powers of x are allowed. The highest power of x that occurs is called the degree of the polynomial. The graph shows examples of degree 4 and degree 5 polynomials. The degree gives the maximum number of “ups and downs” that the polynomial can have and also the maximum number of crossings of the x axis that it can have.
Polynomials are useful for generating smooth curves in computer graphics applications and for approximating other types of functions.

Rational Functions
(ratios of two polynomials, or a polynomial divided by another polynomial)
These functions are the ratio of two polynomials. One field of study where they are important is in stability analysis of mechanical and electrical systems (which uses Laplace transforms).
When the polynomial in the denominator is zero then the rational function becomes infinite as indicated by a vertical dotted line (called an asymptote) in its graph. For the example to the right this happens when x = −2 and when x = 7.
When x becomes very large the curve may level off. The curve to the right levels off at y = 5.

Exponential Functions
y = a b x
where x is in an exponent (not in the base as was the case for power functions) and a and b are constants. (Note that only b is raised to the power x; not a.) If the base b is greater than 1 then the result is exponential growth. Many physical quantities grow exponentially (e.g. animal populations and cash in an interest-bearing account).
If the base b is smaller than 1 then the result is exponential decay. Many quantities decay exponentially (e.g. the sunlight reaching a given depth of the ocean and the speed of an object slowing down due to friction)

Logarithmic Functions
y = a ln (x) + b
where x is in the natural logarithm and a and b are constants. They are only defined for positive x. For small x they are negative and for large x they are positive but stay small. Logarithmic functions accurately describe the response of the human ear to sounds of varying loudness and the response of the human eye to light of varying brightness.

Sinusoidal Functions
y = a sin (b x + c)
where a, b and c are constants. Sinusoidal functions are useful for describing anything that has a wave shape with respect to position or time. Examples are waves on the water, the height of the tide during the course of the day and alternating current in electricity. Parameter a (called the amplitude) affects the height of the wave, b (the angular velocity) affects the width of the wave and c (the phase angle) shifts the wave left or right.

A function is even if the graph is symmetric with respect to the ___-axis
A function is even if the graph is symmetric with respect to the y-axis
A function is odd if the graph is symmetric with respect to the ___
A function is odd if the graph is symmetric with respect to the origin
Is this even or odd?
f(-x) = f(x)
Even iff
f(-x) = f(x)
for all x in the domain of f
Is this even or odd?
f(-x) = - f(x)
Even iff
f(-x) = - f(x)
for all x in the domain of f


