Functions and Graphs Flashcards
(51 cards)
Relation
Any set of ordered pairs. The set of all first components of the ordered pairs is called the domain of the relation and the set of all second components is called the range of the relation.
Function
A relation in which each member of the domain corresponds to exactly one member of the range.
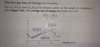
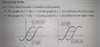
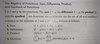
Vertical Line Test for Functions
If any vertical line intersects a graph in more than one point, the graph does not define y as a function of x.
Zeros of a Function
The x-values for which f(x) = 0.
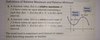
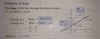
Increasing Functions

Decreasing Functions

Constant Functions
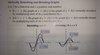
Relative Maximum

Relative Minimum
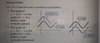
Symmetry and Tests for Symmetry
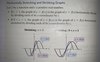
Even Functions and Their Symmetries
The function f is an even function if
f( -x ) = f( x ) for all x in the domain of f.
The graph of an even function is symmetric with respect to the y-axis.
Odd Functions and Their Symmetries
The function f is an even function if
f( -x ) = - f( x ) for all x in the domain of f.
The graph of an even function is symmetric with respect to the origin.
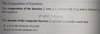
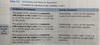
Identifying Even or Odd Functions from Equations
- Even function: f( -x ) = f( x )
The right side of the equation of an even function does not change if x is replaced with -x. - Odd function: f( -x ) = -f( x )
Every term on the right side of the equation of an odd function changes sign if x is replaced with -x. - Neither even nor odd: f( -x ) <> f( x ) and f( -x ) <> -f( x )
The right side of the equation changes if x is replaced with -x, but not every term on the right side changes sign.
Piecewise Function
A function that is defined by two (or more) equations over a specified domain.
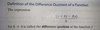
Difference Quotient of a Function
Slope
Positive Slope
Negative Slope

Zero Slope

Undefined Slope

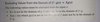
Point-Slope Form of the Equation of a Line
The point-slope form of the equation of a nonvertical line with slope m that passed through the point ( x1 , y1 ) is
y - y1 = m ( x - x1 )
Slope-Intercept Form of the Equation of a Line
The slope-intercept form of the equation of a nonvertical line with slope m and y-intercept b is
y = mx + b
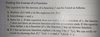
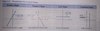
Graphing y = mx + b Using the Slope and y-intercept
- Plot the point containing the y-intercept on the y-axis. This is the point ( 0 , b ).
- Opbtain a second point using the slope, m. Write m as a fraction, and use rise over run, starting at the point containing the y-intercept, to plot this point.
- Use a straightedge to draw a line through the two points. Draw arrowheads at the ends of teh line to show that the line continues indefinitely in both directions.
Equation of a Horizontal Line