Chapter 3: Flashcards
What is arithmetic Mean
the most commonly used measure of central tendency - affected by extreme values - sum of all numerical values then dividing them by total number of observations - do NOT use when data has extreme values
What is the most commonly used measure of central tendency
arithmetic mean
can you use arithmetic mean if there are extreme values
you should not use it
what is median
middle value in an ordered array of data - not affected by extreme values (outliers) - if N is odd, the median is the middle number - if n is even, the median is the average of the two middle numbers
is median affected by extreme values
no
what is mode
the value in a set of data that appears most frequently - not affected by extreme values - used for descriptive purposes (because it is more variable from sample to sample than other measure of central tendency
is mode affected by extreme values
no
which measure of central tendencay is used for descriptive purposes
mode
what is geometric mean
multiply all the numbers together than to the exponent of 1/number of variables - help measure the status of an investment over time - useful measure of the rate of change or a variable over time
what central tendancy helps measure the status of an investment over time
geometric mean
what central tendency is useful for measuring the rate of change or a variable over time
geometric mean
What are quartiles
- most widely used measure of noncentral location - used to describe properties of large stes of numerical data - whereas the median is the value that splits the ordered array in half (50% of the observations are smaller and 50% are loarger) quartiles are descriptive measure s that split the ordered data into 4 quarters
what is the most widely used measure of non-central location
quartiles
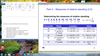
how do you compute quartiles
- Determine the location (total numbers +1)x 25/100 = Qartile1 (total numbers +1) x 50/100 = quartile 2 (total numbers +1 ) x 75/100 = quartile 3
- Locate the number in the list
for instance location of 2.75 is between number3 and 6
6-3 = 3 x .75 (for the first quartile, .5 for second and .25 for 3rd)
=2.25 + 3 (the first number )= 5.25

What is measure of variation
descrives numerical data - the amount of dispersion or spread in the data - two sets of data may differe in both central tendency an dvariation - or they may have the same measures of variation but different central tendencies or - two sets of data may have the same measures of central tendency but greatly different variation
what are the 5 measures of variation
- range 2. interquartile range 3. variance 4. standard deviation 5. coefficient of variation
what is range
is the difference between the largest and smallest observation in a set of data - measure the total spread in the set of data - simple weakness is that it does not take into account how the data are distributed between the smallest and largest values
What is interquartile range
- also called midspread - difference between the third and first quartiles in a set of data - subtract the first quartile form the third quartile - not influenced by extreme values
How do you calcluate rane?
Highest number - the smallest number
How do you calculate the Variance?
- Calcluate the mean (largest number - smallest number)
- calcluate the variance
- subtract the mean
- the square the result
- the add up the squared numbers
- then once we sum up the square differences we divide by the number of values in the population to get the average squared difference - 1?
Why can Bariances be hard to interpret
because they can be quite large
why use standard deviation?
because variance can be quite large
how do you calculate the standard deviation?
square root of the variance
What is the Coefficient of Variation (CV)?
measure of variability relative to the mean
How do you calcluate Coefficient of Variation
Calculate:
Take the standard deviation and divided it by the mean
Standard deviation / mean = a %
Useful for comparing two data sets to see which one is more variable
why would you use Coefficient of Variation (CV)?
useful for comparing two data sets to see which one is more variable
What are the Calcluations for a box and Whisker Plot (5 Number Summary)
- Determine the smallest number
- Determine the quartiles
Total number of numbers + 1 x 25/100 = quartile 1 %
Then find the amount in the list of numbers
Total number of numbers + 1 x50/100 = 2nd quartile %
Total number of numbers + 1 x 75/100 = 3rd quartile %
- Determine the median
Median is Quartile 2
- Determine the largest number
How do you determine a box and whisker plot

- determine the quartiles
- ????????????

how do you Calculate the interquartile range?
3rd quartile - 1st quartlie
- 50% of the observations are within the box ?
Explain how to understand the box and whisker plot regarding outliers
- true as long as there are no outliers (found as dots at the end of the whiskers)
- if it is a value gerater than the value of the 3rd quartile + 1.5 x interquartile range
- OR if it is less than the value of the first quartile - 1.5 x interquartile range
these show you if there are outliers

what are the measures of variation?
- range
- variance
- stnadard deviation
- coefficient of variation
What are the shapes of Distribution and what does it mean
Describes how data is distributed
measure of shape can be
- Symmetric or
- skewed (left skewed or right skewed)
The 5 number summary what is it used for
to determien the shape of a distribution (box and whisker summary)
What is the 5 number summary a measure of?
a measure of
- central location as well as
- relative standing
what does percentile mean
what number has a ceratain % of the data below that number
(ie. 25 percentile means 25% of hte numbers are below that number)
what do the measures of assocaition measure?
how strong the relationship is between two variables
- specifically, we are most intersted in linear relationships (where catter plots show a striaght line)
What does covariance measure
measures how two variables change together
- if one goes up does the other go up? or will it go down? or do we know nothing at all (vairables are not assocaited with each other)
how do you calclaute covariance
difference of the mean from each data point (like variance)
- we use both data sets and multiply differnces together
- if one increases when other decreases consistently
- will be negative (positive x negative)
- covariacne will be high and negative - if they increase and decrease together consistently
- will be positive (positive x positive or negative x negative)
- covariance will be high and positive
if inconsistent - some psositves and negatives, covariance will be low (may be negative or positive)
for covariance, if one variable increases when the other decreases consistently, what does this show
it will be negative (positve x negative)
- covariance will be high and negative
for covariance, if they increase and degrease together consistently, what does this show
will be positive (positve x positive or negative x negative)
- covariance will be high and positive
for covariance, if the variables are incosistent, what does this show
some psositve and negatives
- covaraince will be low (MAY BE POSITVE OR NEGATIVE)
for covariance the higher the number shows what
the higher numer shows a stronger relationship
what does coefficeint of correlation show
shows the linear relationship
how do you calcluate the coefficient of correlation?
COVARIANCE / (STANDARD DEVIATIONS MULTIPLIED TOGETHER)
- -1 means perfect negative linear relationship
- 0 means no relationship
- +1 means perfect positive linear relationship
what are the features of correlation coefficent
- unit free
- ranges between -1 and 1
- the closer to -1, the stronger the engative linear relationship
- the clsoer to 1, the stronger the psotive linear relationship
- the clsoer to 0, the weaker any positive or negative linear relationship
How do we display correlation coefficcents?
scatter plots? add pic if remember
what are some ethical considerations
- should document both good and bad results
- should be presented in a fair, objective and neutral manner
- should not use inappropriate summary mesures to distrort facts