Basic Terminology Flashcards
(31 cards)
Quantitative Data v. Qualitative Data
quan. - numerical data; data measured or identified on a numerical scale
qual. - categorical data; data that can be classified in a group
context will determine if quan. or qual.
Discrete Data v. Continuous Data
disc. - data that can be listed or placed in order; usually finite but may be “countably” infinite (identify first or second term but not last)
cont. - data that can be measured or take on values in an integral
Descriptive Statistics (EDA) v. Inferential Statistics
desc. - exploratory data analysis (analytical, graphical); examines data
inf. - uses data to make inferences about the population from which the sample is drawn (commonly random sample)
Parameters v. Statistics
stats. - values that describe a sample
para. - values that describe a population
Collecting Data: Surveys v. Studies
used to collect data in order to make generalizations about a population
experiments or observational studies involve collecting comparative data on groups (treatment and control)
Random Variable and Distributions
can be thought of as a numerical outcome of a random phenomenon or an experiment; give rise to probability distrubutions (a way of matching outcomes with their probabilities of success) which leads to probabilistic statements about sampling distributions (distributions of sample statistics such as means and proportions)
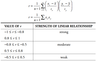
Graphical Analysis: Shape
symmetric - has symmetry around some axis (does not need to be perfectly symmetrical)
mound-shaped - bell-shaped
skewed - data are skewed to the left if the tail is to the left; to the right if the tail is to the right
bimodal - has more than one location with many scores
uniform - frequencies of the various values are more-or-less constant
Graphical Analysis: Dotplot v. Stemplot
dot - very simple type of graph that involves plotting the data values, with dots, above the corresponding values on a number line
stem - no rules to what constitutes the stem and what constitutes the leaf; data will suggest the stem and leaves
Graphical Analysis: Bargraph v. Histogram
bar - used to illustrate qualitative data; horizontal axis is categories
hist - used to illustrate quantitative data; horizontal axis is numerical values
vertical axis of both is frequencies or relative frequencies
Measures of Center: Mean
defined as the sum of the x’s divided by n
not resistant statistic (can be affected)
can remove indices and leave summation notation

Measures of Center: Median
“middle” value in the set; if even, add middlemost two and divide by 2
resistant statistic (one whose numerical value is not dramatically affected by extreme values)
Measures of Center: Mode
tells where the most frequent values occur, more than it describes the center
generally not used
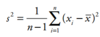
Measures of Spread: Variance
average squared deviation from the mean
Measures of Spread: Standard Deviation
square root of the variance; used to match the units of the original data

Measures of Spread: Interquartile Range (IQR)
measure of spread that works well when a mean-based measure is not appropriate
median is Q2 (50th percentile) and divides the distribution
lower quartile (Q1, 25th percentile) is median of lower half
upper quartile (Q3, 75th percentile) is median of upper half
IQR = Q3–Q1 = middle 50% of distribution
Measures of Spread: Range
difference between the maximum and minimum scores in the distribution
generally not used
Measures of Spread: Outliers and the 1.5(IQR) Rule
outliers - value far removed from the others
1.5(IQR) Rule, pictured
extreme outlier - lies more than 3 IQRs beyond Q1 or Q3
Position of a Term in a Distribution: 5-Number Summary
a dataset is composed of the minimum value, the lower quartile, the median, the upper quartile, and the maximum value
Position of a Term in a Distribution: Boxplot
simply a graphical version of the 5-number summary; contains the middle 50%
“whiskers” extend from the lines at the ends of the box to the minimum and maximum values of the data, disregarding outliers
line inside box marks median
Position of a Term in a Distribution: Percentile Rank of a Term
equals the proportion of terms in the distribution less than the term; 100th percentile is max
eg. term that is at the 75th percentile is larger than 75% of the terms in a distribution
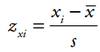
Position of a Term in a Distribution: z Score
notes how many standard deviations the term is above or below the mean
positive when x is above the mean and negative when it is below the mean
Normal Distribution and the Empirical Rule
graph of ND - a continuous curve that “describes” the shape of the distribution for very large samples; normal curve is defined completely in terms of its mean and standard deviation
Standard Normal Deviation
X is a variable that has a normal distribution
mean µ
standard deviation s
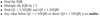
Empirical Rule v. Chebyshev’s Rule
empirical - 68-95-99.7 rule; states that approximately 68% of the terms in a normal distribution are within one standard deviation of the mean, 95% are within two , and 99.7% within three
chebyshev’s - k is number of standard deviations; for k > 1, at least (1 - k^(-2))% of the data lies within k standard deviations of the mean