BA Chapter 6 Flashcards
1
Q
- This is on the quiz:
Population Frame is the list from which sample is selected.
A
2
Q
- Sampling distribution of the mean
- Formed by the means of all possible samples of a fixed size n from some population.
- Standard error of the mean
- The standard deviation of the sampling distribution of the mean.
- This is referred to as the standard error.
- Formula std error: attached image (front).
- Larger sample sizes have less sampling error and provide greater accuracy in estimating the true population mean.

A
3
Q
- If the sample size is ______ enough, then the sampling distribution of the mean:
- is approximately _______ distributed regardless of the distribution of the _______.
- has a mean equal to the _______ mean.
- If the population is normally distributed, then the sampling distribution is also _______ distributed for any sample size.
- The Central Limit Theorem is one of the most important practical results in ______.
A
- large
- normally; population
- population
- normally
- statistics
4
Q
Sampling distribution is a distribution of _______.
A
means.
5
Q
- _________ is the most common form of sampling, select items from a population so that every subset of a given size has an equal chance of being selected.
There are other useful methods of obtaining a random sample from a population:
- Systematic (or Periodic) sampling
- Randomly select ____ subject (NOTE: it’s not a random sample without this!!!).
- After the above step, select every ____ subject until you get your sample size.
- k can be _______.
- Stratified sampling
- Divide population into naturally occurring ______ or strata.
- Randomly select n subjects from ______.
- Example: see the attached image (front).
- Sample ni=25 students from each strata. No problem if N1 = N2 = N3 = N4 = N5
- But what if the size is unequal in each strata? Then you can use a proportional method based on stratum size. See the attached image (back).
A
- Simple Random Sampling
- Systematic (or Periodic)
- first
- kth
- any number
- Stratified
- subgroups
- every stratum

6
Q
- Cluster sampling
- Use when you have many, many ______ (clusters).
- Divide population into _______ subgroups called clusters.
- Randomly select clusters, then perform a census (i.e., ______ ) in each selected cluster.
- Example: see the attached image (front)
- Sampling from a continuous process
- Select a _____ at random, then select the next n items produced after that time; OR
- Select ______ at random, then select the next item produced after these times.
- Very useful for ________.

A
- Cluster
- subgroups
- distinctly different
- sample everyone
- Sampling from a continuous process
- time
- n times
- Quality Control
7
Q
Subjective Sampling Methods include:
- Convenience sampling
- Samples are selected based on the ease with which the data can be collected (survey all customers who happen to visit this month).
- Judgment sampling
- Expert judgment is used to select the sample (survey the best customers).
A
8
Q
- Interval Estimate is the ______ within which we believe the true population _______ falls.
- Confidence Interval Estimates is an interval estimate that specifies the ________ that the interval contains the true population parameter.
- Quiz question: definition of confidence interval vs. definition of interval estimate
- Margin of Error is the ______ of the Confidence Interval. Margin of error depends on the level of confidence and sample size.
- Interval Estimate = Point Estimate +/- Margin of Error
- Level of Confidence (1 – α) is the probability that the Confidence Interval contains the true population parameter, usually expressed as a _______.
A
- range; parameter
- half-width
- none
- likelihood
- percentage
9
Q
- Sampling (statistical) error occurs because samples are only a subset of the total population.
- Inherent in sampling process so try to minimize it.
- Sampling error depends on the size of the sample relative to the population.
- Tradeoff between cost of sampling and accuracy of estimates obtained by sampling.
- Nonsampling error occurs when the sample does not adequately represent the target population.
- Nonsampling error usually results from a poor sample design or choosing the wrong population frame.
A
10
Q
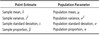
- Estimators are measures used to estimate unknown population parameters.
- Point Estimate is a single number derived from a sample that is used to estimate a population parameter.
- Example for Estimator & Point Estimate: see attached image (front).
- Unbiased Estimators - the expected value of the estimator equals the population parameter. For example, m is an unbiased estimator of m.
A
11
Q
- (1 – α) is the probability that the Confidence Interval contains the true population parameter, usually expressed as a percentage. A Confidence Interval of 100(1 − α)% is an interval [A, B] such that the probability of falling between A and B is 1− α.
- α is the desired significance level: 0 < = α <= 1
- 1− α is called the confidence level.
A
- Confidence intervals provide a way of assessing the accuracy of a point estimate.
- Confidence intervals estimate the value of a parameter such as a MEAN or PROPORTION

12
Q
The type of CI depends on the population parameter of interest and the information that we have available.
- CI about the mean (x̄ ), population σ known
- CI about the mean (x̄ ), population σ unknown
- CI about the proportion (p̂ )
- CI about the population variance σ2
- CI for a population total (N)

A
- Confidence Interval For the Mean, σ Known:
- Use z distribution as the sampling distribution
- Formula for CI: See the attached image (front)
- Calculate za/2 using the NORM.S.INV()
- Calculate the Standard Error = σ /sqrt(n)
- Calculate the Margin of Error = za/2 * Standard Error
- OR use this function: CONFIDENCE.NORM(alpha, stdev, size) to directly calculate Margin of Error.
- Finally, add (add can get upper bound) and subtract (subtract can get lower bound) the Margin of Error from the Sample Mean to obtain a 95% Confidence Interval.
- zα/2 is the value of the standard normal random variable for an upper tail area of α/2 (or a lower tail area of 1−α/2).
- Confidence Interval For the Mean, σ Unknown:
- When the population σ is unknown, we use the t distribution instead of the z distribution.
- Only parameter is the degrees of freedom (df).
- The t distribution is similar in shape to the z distribution.
- Since we don’t know population σ, we will use sample std deviation (s) to estimate σ. See attached image (back) for the formula for CI.
- We can find tα/2,n-1 using the Excel function T.INV(confidence level, df) but be careful here, the confidence level represents all of the area to the left of the upper tail area and since a is divided by 2, that area is 1-α/2.
- OR we can use CONFIDENCE.T(alpha, stdev, size) to directly calculate Margin of Error. And here we just use α, not α/2
- tα/2 is the value of the t-distribution with df = n − 1 for an upper tail area of α/2.

13
Q
The type of CI depends on the population parameter of interest and the information that we have available.
- CI about the mean (x̄ ), population σ known
- CI about the mean (x̄ ), population σ unknown
- CI about the proportion (p̂ )
- CI about the population variance σ2
- CI for a population total (N)

A
- CI about the proportion (p̂ )
- Formula: see attached image (front)
- We can find zα/2 using the Excel function =NORM.S.INV(1-α/2)
- 1-α/2 (is all of the area to the left of z)
- Next, we need to calculate the standard error using the formula (attached front).
- Use the SQRT() function.
- Finally, calculate the CI.
*
14
Q
- Note that increasing the sample size:
- Decreases the width of CI
- Gives a more accurate estimate of the
true population parameter - Increases costs
A
